Data Interpretation Practice Question and Answer
8 Q:Directions : Given here is a pie chart showing the cost of gold in 2010, 2011, 2012 and 2013. Study the chart and answer the following questions
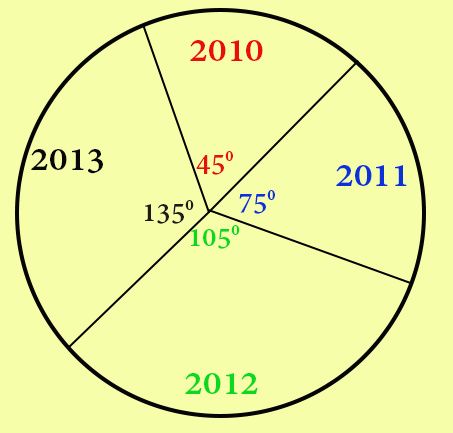
The percentage increase in the price of gold from the year 2011 to 2013 is
813 064539e95f3618908bf5e0c4e
64539e95f3618908bf5e0c4e- 150%false
- 260%false
- 370%false
- 480%true
- Show AnswerHide Answer
- Workspace
- SingleChoice
Answer : 4. "80%"
Q: In a school of 200 students, the following chart represents the percentage of students involved in different sports.
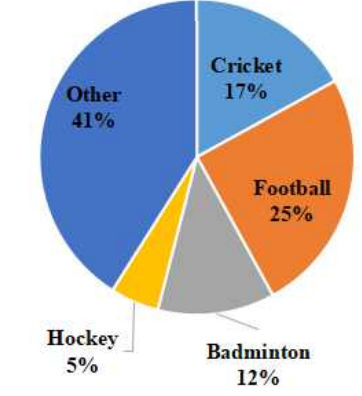
What is the number of students playing cricket?
810 06446675c5bae6d689245fb33
6446675c5bae6d689245fb33- 117false
- 283true
- 324false
- 434false
- Show AnswerHide Answer
- Workspace
- SingleChoice
Answer : 2. "83 "
Q:Directions: The following pie chart show proportion of population of seven villages in 2009. Stud the pie chart and answer question that follows:
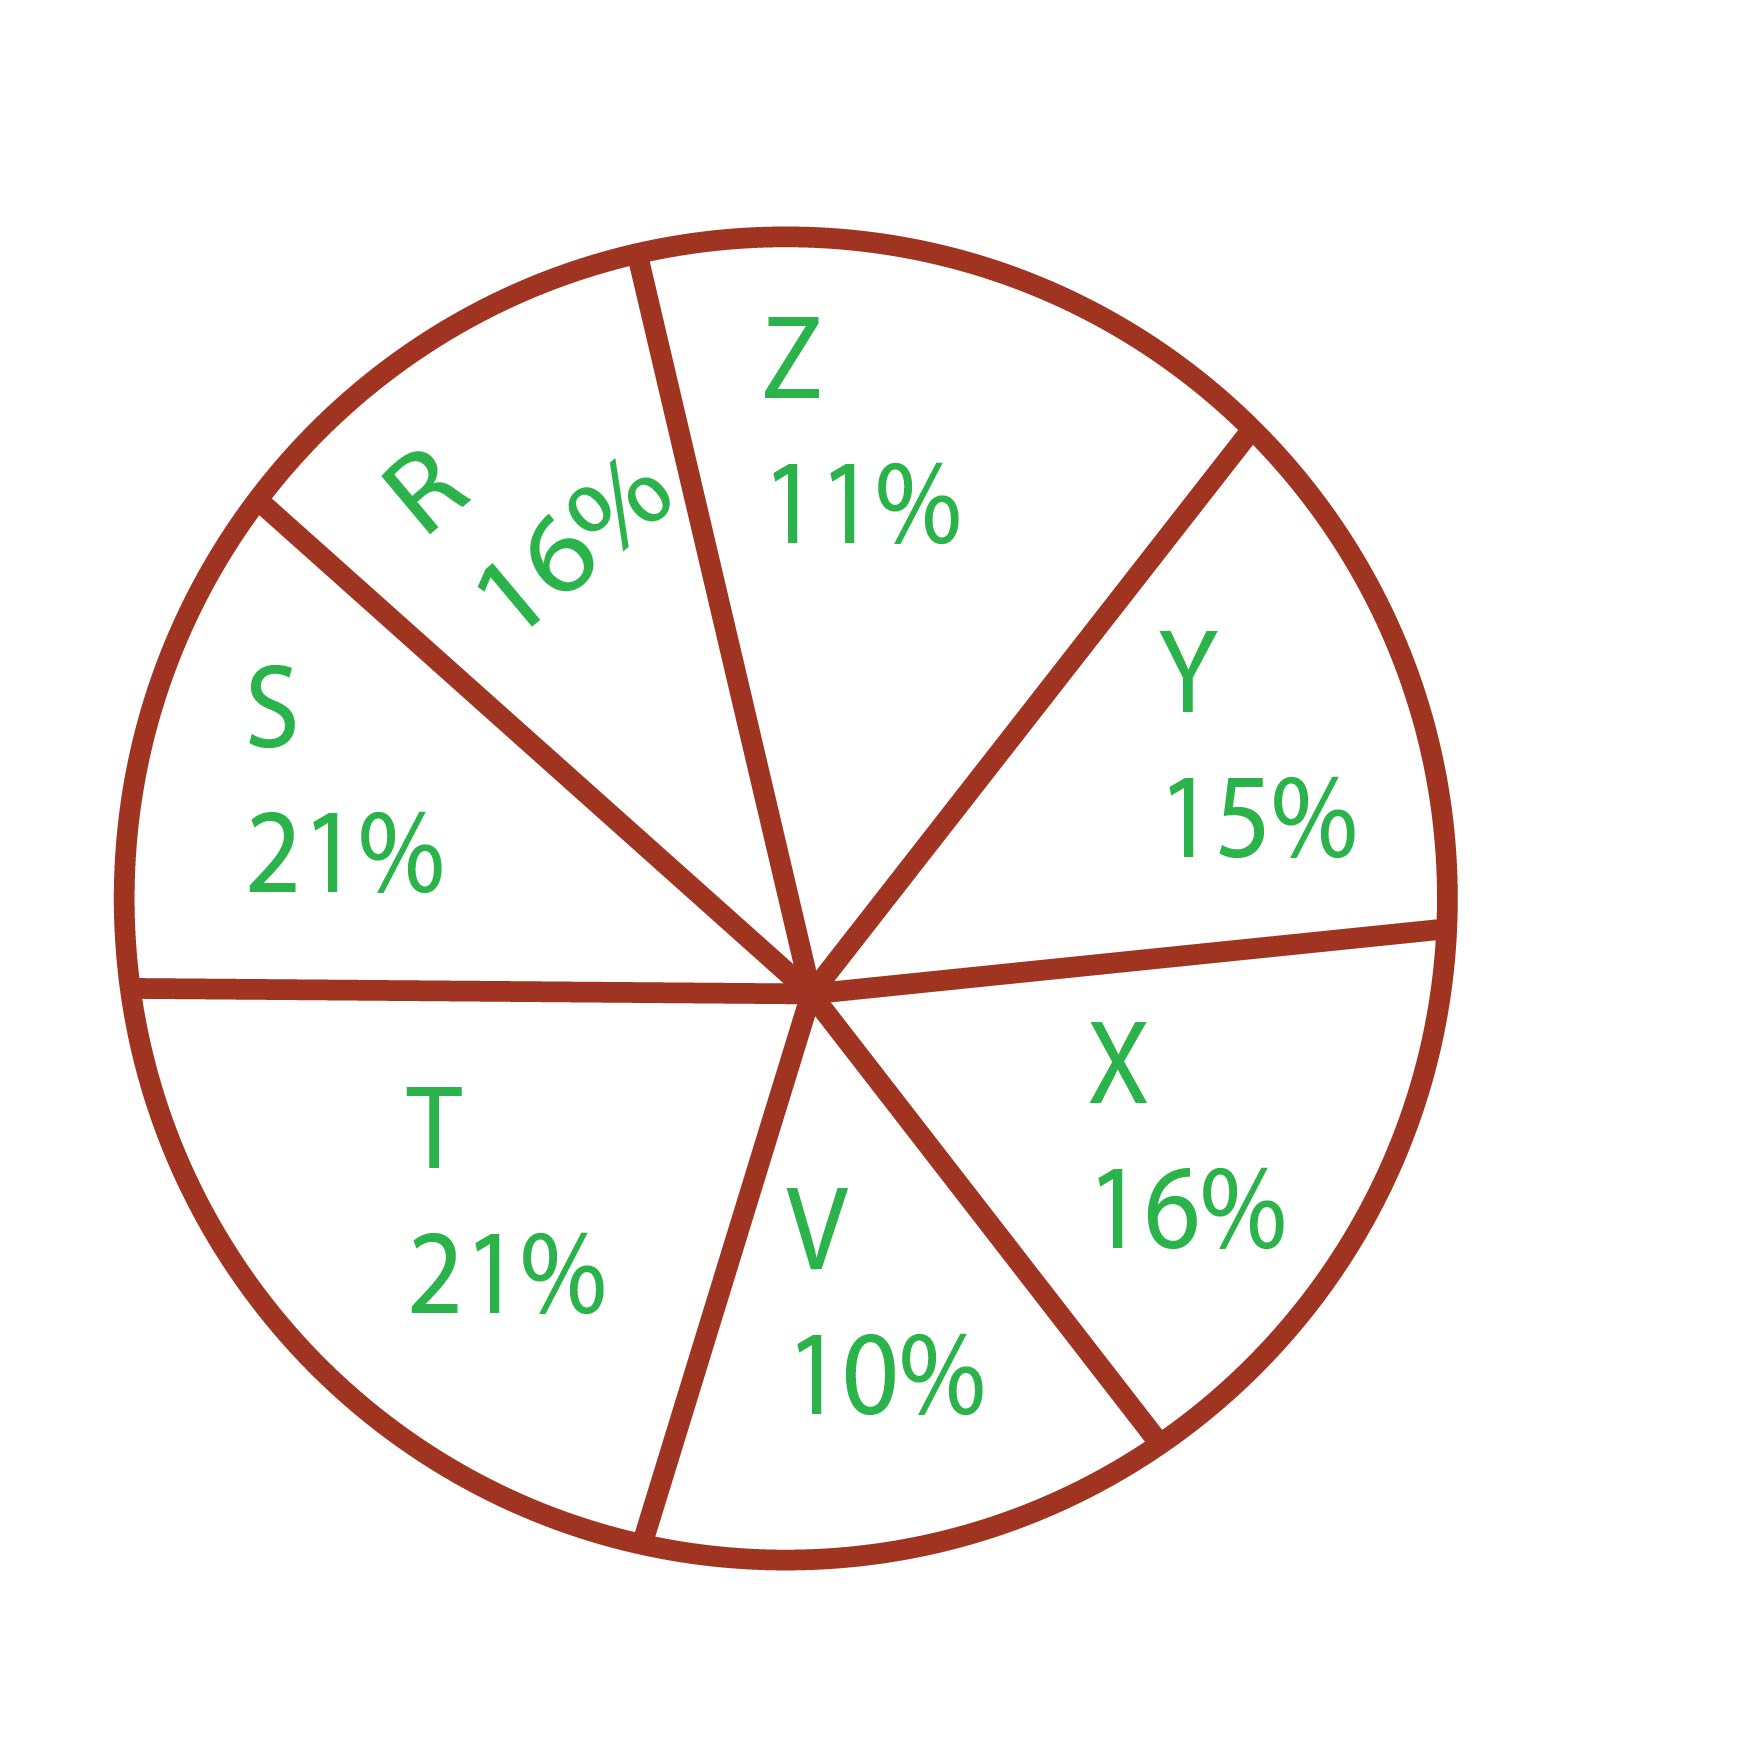
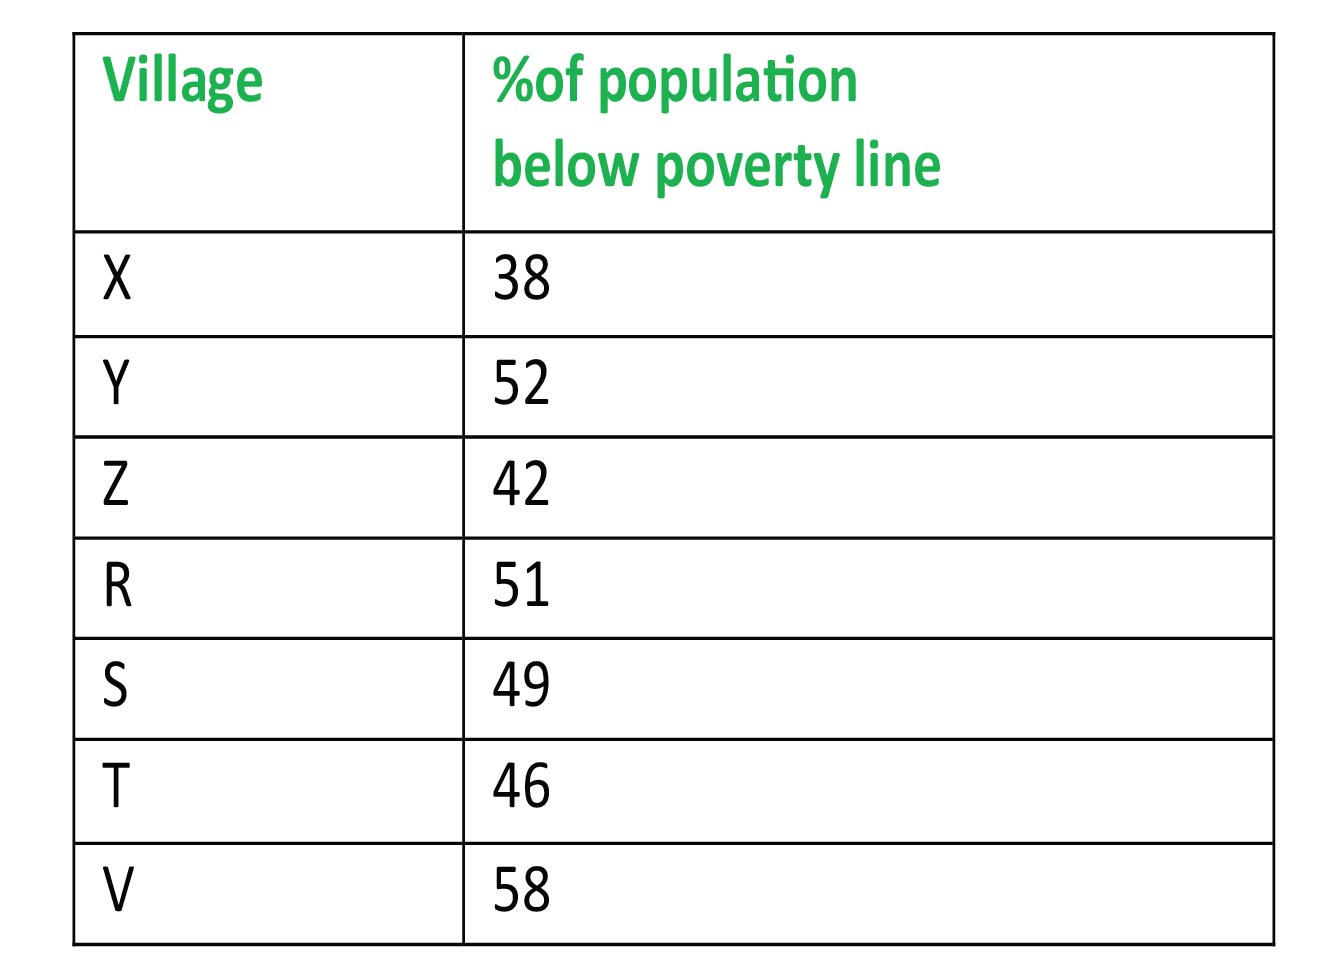
If the below poverty line population of the village 'X' is 12160, then the population of village 'S' is
808 0640876443218fd8d147bda90
640876443218fd8d147bda90- 118500false
- 220500false
- 322000true
- 420000false
- Show AnswerHide Answer
- Workspace
- SingleChoice
Answer : 3. "22000"
Q:Directions : Study the following pie chart carefully and answer the questions. The pie chart represents the percentage of people involved in various occupations.
Total number of people = 20000
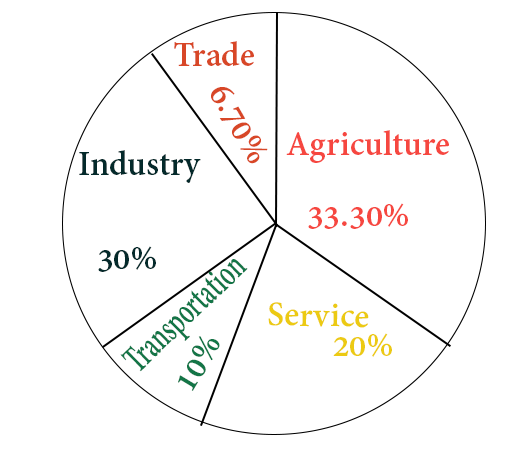
The difference between the maximum number of people involved and minimum number of people involved in various professions is
805 06453a55339143d085f3e5a73
6453a55339143d085f3e5a73Total number of people = 20000
- 12640false
- 23640false
- 36320false
- 45320true
- Show AnswerHide Answer
- Workspace
- SingleChoice
Answer : 4. "5320"
Q:Directions : Study the following bar graph and answer the questions.
company (in lakhs of rupees) for the years 1994-1997:
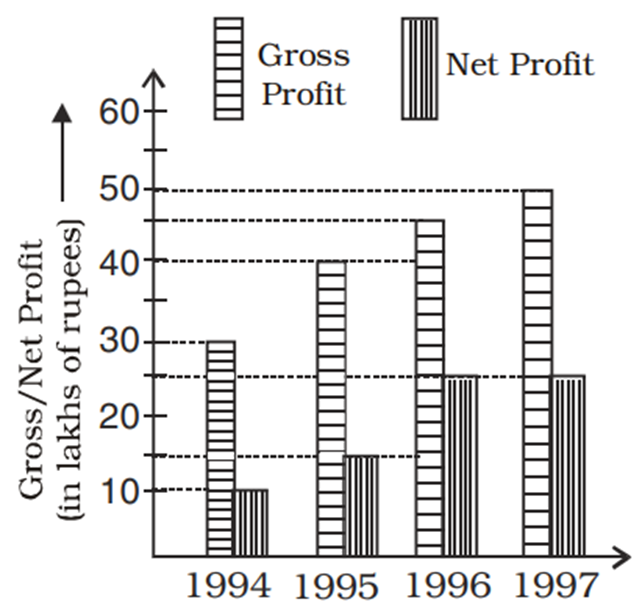
The difference of average gross profit and average net profit calculated for four years is
804 06460f5b04f2cce984334df0c
6460f5b04f2cce984334df0c- 118.75 lakhsfalse
- 219.75 lakhsfalse
- 320.5 lakhsfalse
- 422.5 lakhstrue
- Show AnswerHide Answer
- Workspace
- SingleChoice
Answer : 4. "22.5 lakhs "
Q:Direction: Read the following graph carefully and answer the following questions:
The following bar graph shows the quantity(in kg) of wheat, rice, pulses and salts sold by two companies P and Q in the month of January.
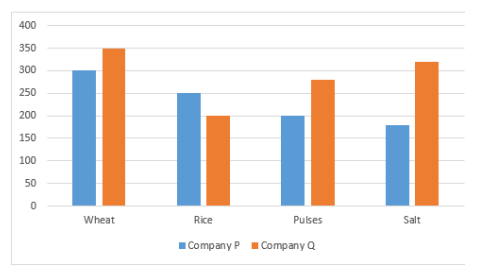
The total quantity of wheat, rice, pulses and salts sold by company P is approximately what percentage more or less than the total quantities sold by company Q?
791 064ddf46580ef1e74b4f17a7c
64ddf46580ef1e74b4f17a7cThe following bar graph shows the quantity(in kg) of wheat, rice, pulses and salts sold by two companies P and Q in the month of January.
- 122% morefalse
- 225% lessfalse
- 315% morefalse
- 412% lessfalse
- 519% moretrue
- Show AnswerHide Answer
- Workspace
- SingleChoice
Answer : 5. "19% more"
Q:Directions : Read the graph and answer the following questions.
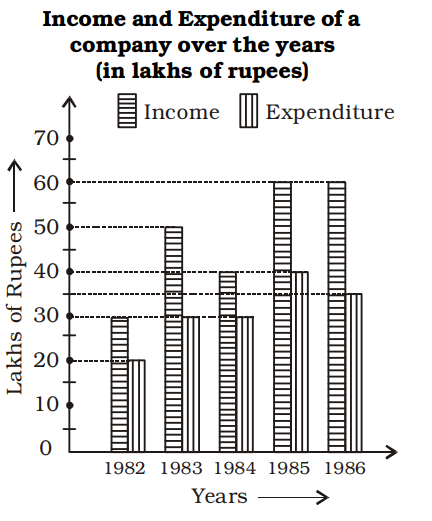
Percentage increase in profit in 1986 over 1982 is
791 06461049b0827e80a9f8acdf9
6461049b0827e80a9f8acdf9- 1150%true
- 2120%false
- 3100%false
- 480%false
- Show AnswerHide Answer
- Workspace
- SingleChoice
Answer : 1. "150% "
Q:Directions: Degree- wise breakup of employees working in various department of an organisation and the ratio to men to women.
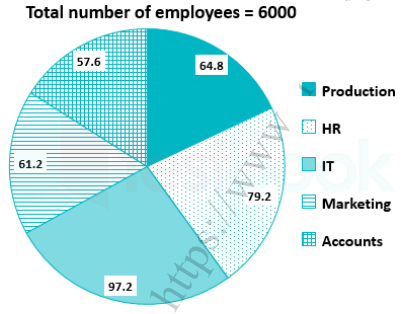
Respective ratio of men to women in each department
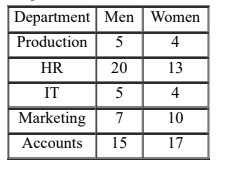
What is the respective ratio of the number of women working in the Marketing department and the number of men working in the Hr department?
790 064da032e462ecdc3adac5f0e
64da032e462ecdc3adac5f0e- 13 : 4true
- 24 : 5false
- 37 : 5false
- 44 : 7false
- 59 : 4false
- Show AnswerHide Answer
- Workspace
- SingleChoice