Data Interpretation Practice Question and Answer
6 Q:Directions : Read the graph and answer the following questions.
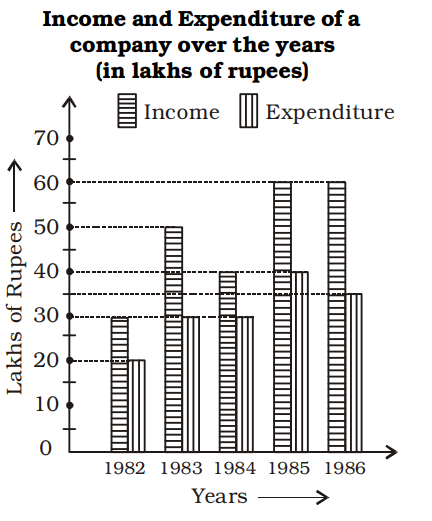
The total income exceeds the total expenditure over the years1982 to 1986 by
719 064610542f75f230a7a71f3b1
64610542f75f230a7a71f3b1- 185 lakhstrue
- 2105 lakhsfalse
- 3115 lakhsfalse
- 4120 lakhsfalse
- Show AnswerHide Answer
- Workspace
- SingleChoice
Answer : 1. "85 lakhs "
Q:Directions: The following Pie Chart shows the export of different food grains from India in 2010. Study the chart and answer the questions:
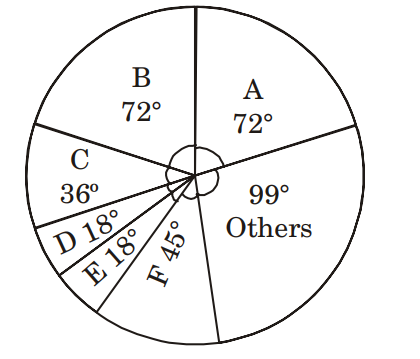
If a total of 1.5 million quintals of crop F was exported, the amount of total food grains exported (in million) quintals was
706 063be697b74eba5069d5135e8
63be697b74eba5069d5135e8- 18.7false
- 212true
- 310.8false
- 49.6false
- Show AnswerHide Answer
- Workspace
- SingleChoice
Answer : 2. "12 "
Q:Directions : Given here is a pie chart showing the cost of gold in 2010, 2011, 2012 and 2013. Study the chart and answer the following questions
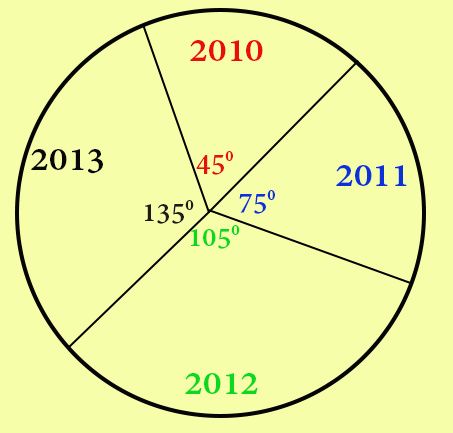
The ratio of percentage increases in price of gold from 2011 to 2012 and 2012 to 2013 is
692 064539f4739143d085f3e3c04
64539f4739143d085f3e3c04- 16 : 5false
- 27 : 5true
- 38 : 5false
- 49 : 5false
- Show AnswerHide Answer
- Workspace
- SingleChoice
Answer : 2. "7 : 5"
Q:Directions : Read the graph and answer the following questions.
The number of years in which the income is more than the average income of the given years is
687 06461029dc899b466f4459a5c
6461029dc899b466f4459a5c- 1Onefalse
- 2Twofalse
- 3Threetrue
- 4Fourfalse
- Show AnswerHide Answer
- Workspace
- SingleChoice
Answer : 3. "Three"
Q:Directions : Study the following bar graph and answer the questions.
company (in lakhs of rupees) for the years 1994-1997:
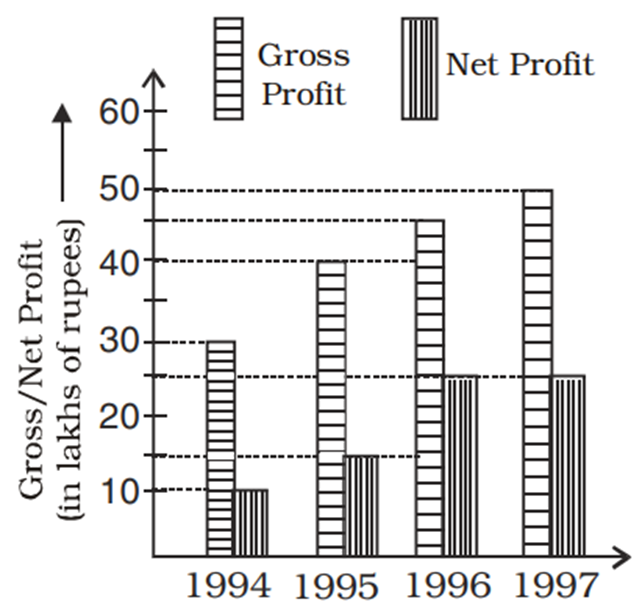
The year in which the gross profit is double the net profit
680 06460f4e7c899b466f4458a0a
6460f4e7c899b466f4458a0a- 11997true
- 21995false
- 31996false
- 41994false
- Show AnswerHide Answer
- Workspace
- SingleChoice
Answer : 1. "1997 "
Q:Direction: The line chart given below shows number of labourers (men and women) working in six different years. Study the data carefully and answer the following questions.
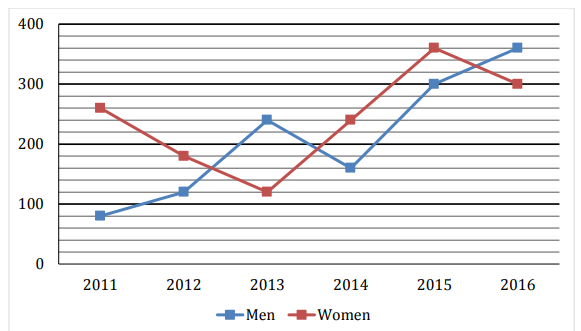
The total number of Men working in 2012 and 2013 together is what per cent of the total number of labourers (Men + Women) working in 2014?
675 064d4ad07ebd5c3747277b3a4
64d4ad07ebd5c3747277b3a4- 160%false
- 270%false
- 380%false
- 490%true
- 540%false
- Show AnswerHide Answer
- Workspace
- SingleChoice