Logical Venn Diagrams Practice Question and Answer
8 Q: In a class, there are 80 students who study both Computer Science and Electronics. While 100 students study Computer Science, 120 Students study Electronics, How many of them study Computer Science only?
2602 05def5bd52c071834c4fd2b47
5def5bd52c071834c4fd2b47- 1100false
- 240false
- 3120false
- 420true
- Show AnswerHide Answer
- Workspace
- SingleChoice
Answer : 4. "20"
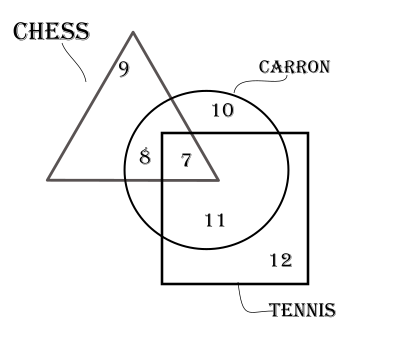
Q: An interview of 60 persons to know whether they play Tennis Chess or Carrom was conducted . The data so obtained has been summarized in a pictorial diagram as shown. Study the diagram and answer the question, how many persons do not play any game?
3382 062540a619dc1941bd9f09b3e
62540a619dc1941bd9f09b3e- 128false
- 257false
- 34false
- 43true
- Show AnswerHide Answer
- Workspace
- SingleChoice
Answer : 4. "3"
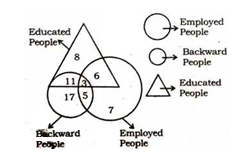
Q: In the following figure, how many educated people are employed?
4283 15d25b5dc9d63ad4996c0a0f0
5d25b5dc9d63ad4996c0a0f0- 118false
- 220false
- 315false
- 49true
- Show AnswerHide Answer
- Workspace
- SingleChoice
Answer : 4. "9"
Q: In a group of 100 people, 50 people like to eat Chicken and 25 people like to eat both Chicken and Mutton. Everyone in the group likes at least one of the two. How many people like mutton only -
1792 0619b8b3777d3000fe534a2eb
619b8b3777d3000fe534a2eb- 150true
- 260false
- 355false
- 440false
- Show AnswerHide Answer
- Workspace
- SingleChoice
Answer : 1. "50"
Q: In a hall of 80 members, 45 members like Lavani, 55 members like Tamasha, 10 members like neither of the two. Then the number of members in the hall who both like is -
1521 0619b891a0e1b7c0fc6032d8b
619b891a0e1b7c0fc6032d8b- 145false
- 225false
- 320false
- 430true
- Show AnswerHide Answer
- Workspace
- SingleChoice
Answer : 4. " 30"
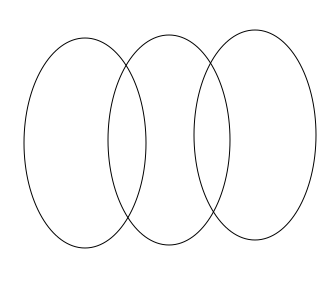
Q: Which Venn diagram best represents the given set of classes?
Married persons, government employees, teachers
1732 06114f16a56340c207008634e
6114f16a56340c207008634e- 1false

- 2true
- 3false
- 4false

- Show AnswerHide Answer
- Workspace
- SingleChoice
Answer : 2. "
"
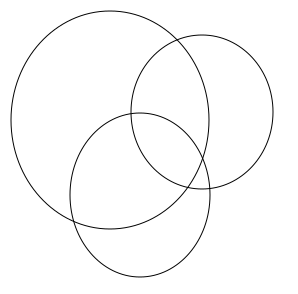
Q: Select the Venn diagram that best illustrates the relationship between the three given classes.
School, Teacher, Student
1409 060f6690bef8c4b405ca5c68f
60f6690bef8c4b405ca5c68fSchool, Teacher, Student
- 1false

- 2false

- 3false

- 4true

- Show AnswerHide Answer
- Workspace
- SingleChoice
Answer : 4. "
"
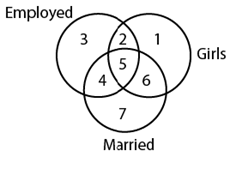
Q: Study the diagram below and identify the region representing girls who are employed but unmarried.
1620 160bdf16705aad558f1cd62a2
60bdf16705aad558f1cd62a2- 12true
- 24false
- 31false
- 45false
- Show AnswerHide Answer
- Workspace
- SingleChoice