Logical Venn Diagrams Practice Question and Answer
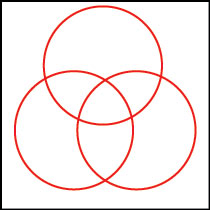
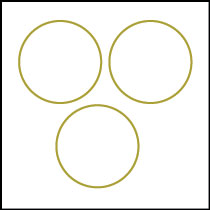
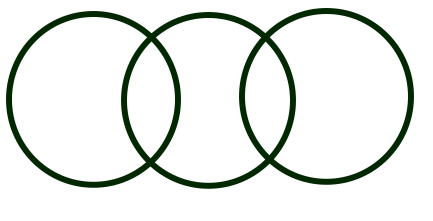
8 Q:Directions: In each of these questions, three words are related in some way. The relationship among the words in the question can best be represented by one of the five diagrams (a), (b), (c), (d) and (e) given below. Mark your answer accordingly.
Iron, Lead, Nitrogen
3554 05ec7cca9112c8637e1b4fb8f
5ec7cca9112c8637e1b4fb8f- 1false
- 2false
- 3false
- 4false
- 5true
- Show AnswerHide Answer
- Workspace
- SingleChoice
Answer : 5. "
"
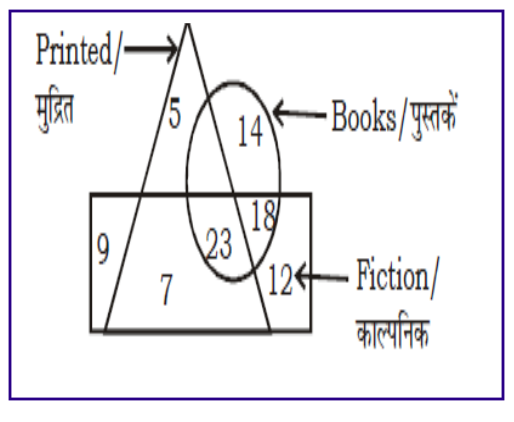
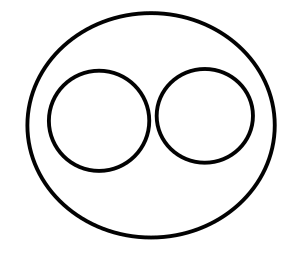
Q: In the given figure, How many books are fiction?
3546 05f3cc2f30716cd43e6d4ed4d
5f3cc2f30716cd43e6d4ed4d- 123false
- 218false
- 353false
- 441true
- Show AnswerHide Answer
- Workspace
- SingleChoice
Answer : 4. "41"
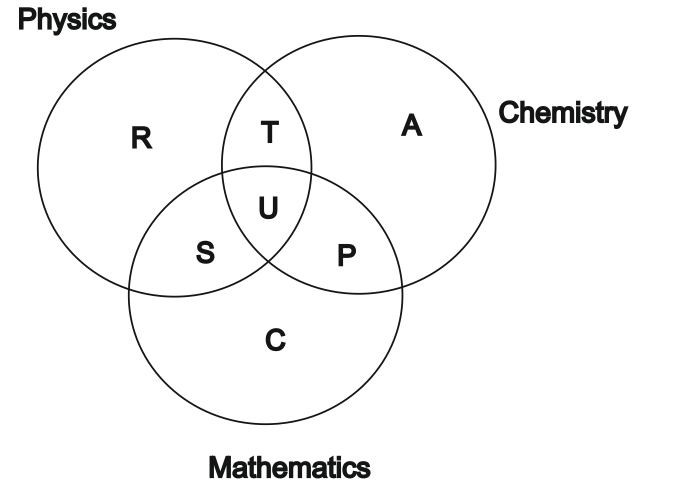
Q: The diagram below represents the students who study Physics, Chemistry and Mathematics. Study the diagram and identify the region which represents students who study both Physics and Chemistry but not Mathematics?
3538 05de89711a2451c6057537af4
5de89711a2451c6057537af4- 1T + S + U + Pfalse
- 2R + T + A + U + P + Sfalse
- 3Cfalse
- 4Ttrue
- Show AnswerHide Answer
- Workspace
- SingleChoice
Answer : 4. "T"
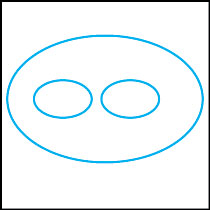
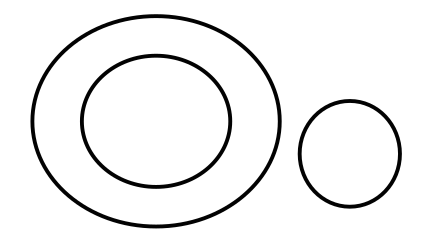
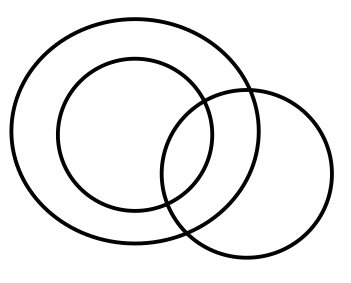
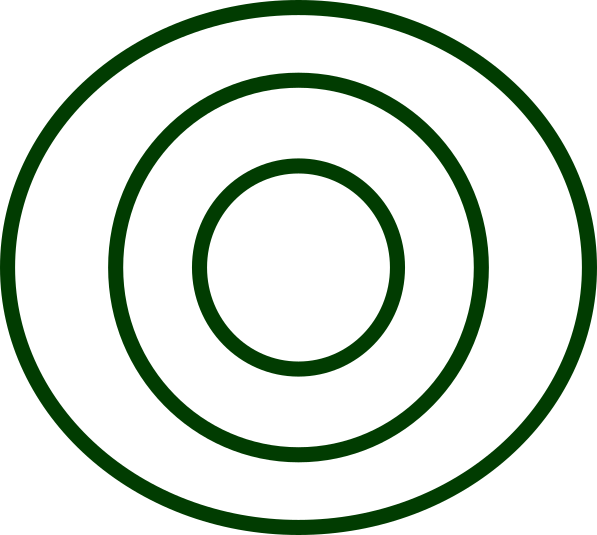
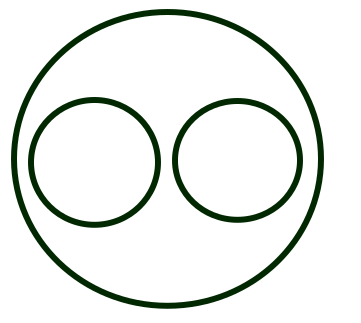
Q: Which Venn diagram expresses the relationship between the following.
(A) Rajya Sabha
(B) Lok Sabha
(C) Parliament
3403 05f9691f3eed3d00d4bc39b35
5f9691f3eed3d00d4bc39b35(A) Rajya Sabha
(B) Lok Sabha
(C) Parliament
- 1false
- 2false
- 3true
- 4false
- Show AnswerHide Answer
- Workspace
- SingleChoice
Answer : 3. "
"
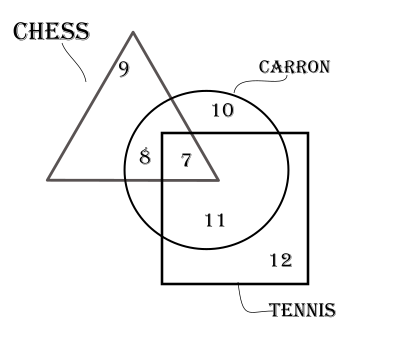
Q: An interview of 60 persons to know whether they play Tennis Chess or Carrom was conducted . The data so obtained has been summarized in a pictorial diagram as shown. Study the diagram and answer the question, how many persons do not play any game?
3382 062540a619dc1941bd9f09b3e
62540a619dc1941bd9f09b3e- 128false
- 257false
- 34false
- 43true
- Show AnswerHide Answer
- Workspace
- SingleChoice
Answer : 4. "3"
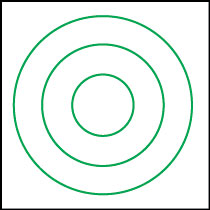
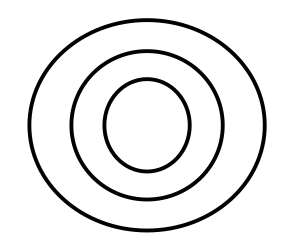
Q: Select the venn diagram that represents the correct relationship between the following classes:
Doctor, Surgeon, Cardiologist
3296 05f51db89d1335638dccc637e
5f51db89d1335638dccc637e- 1false
- 2false
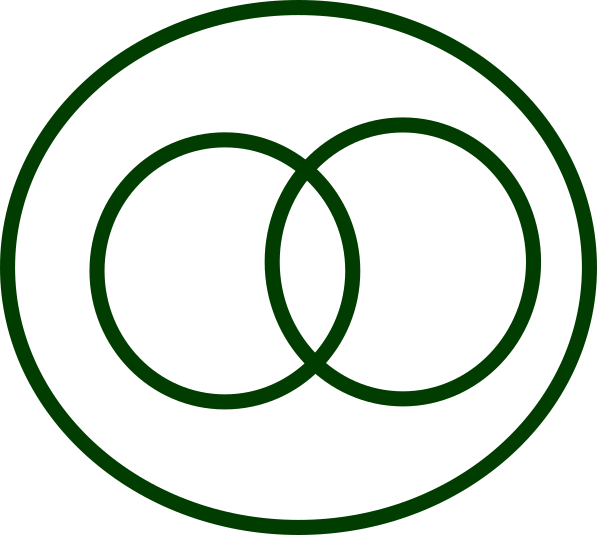
- 3true

- 4false

- Show AnswerHide Answer
- Workspace
- SingleChoice
Answer : 3. "
"
Q: In a class of 54 students, 24 drink milk, 28 drink tea and 8 drink none. Find how many drink both milk and tea?
3253 05eb50ca7a201e2350c47f57b
5eb50ca7a201e2350c47f57b- 18false
- 26true
- 32false
- 410false
- Show AnswerHide Answer
- Workspace
- SingleChoice
Answer : 2. "6 "
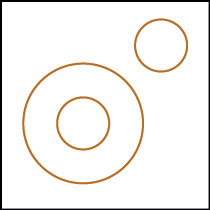
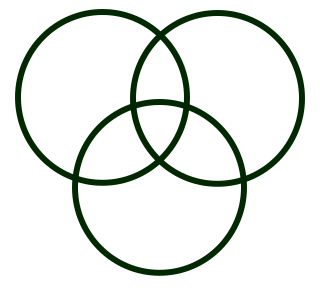
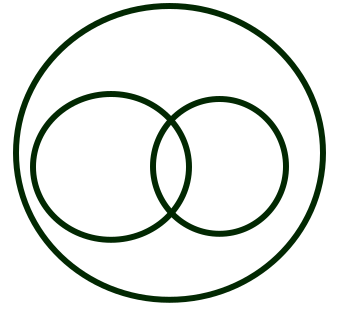
Q: Select the Venn Diagram that best represents the relationship between the following classes.
Male, Doctors, singers
3214 05fc4c02b070eb7152d8121a5
5fc4c02b070eb7152d8121a5Male, Doctors, singers
- 1false
- 2true
- 3false
- 4false
- Show AnswerHide Answer
- Workspace
- SingleChoice
Answer : 2. "
"