Logical Venn Diagrams Practice Question and Answer
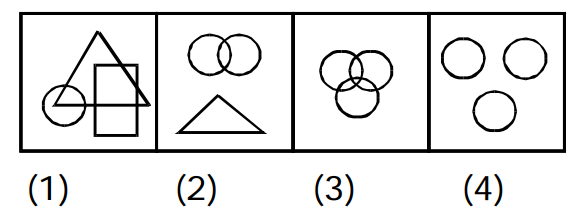
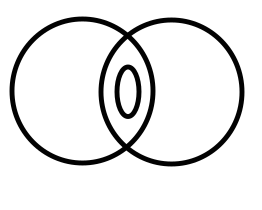
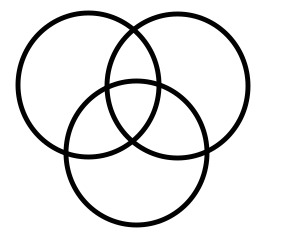
8 Q: Which one of the following diagrams best depicts the relationship among Honey-bee, Honey-bee, Insects and Housefly?
2235 05d92e04d6819c079458b78ad
5d92e04d6819c079458b78ad- 1false
- 2false

- 3true

- 4false
- Show AnswerHide Answer
- Workspace
- SingleChoice
Answer : 3. "
"
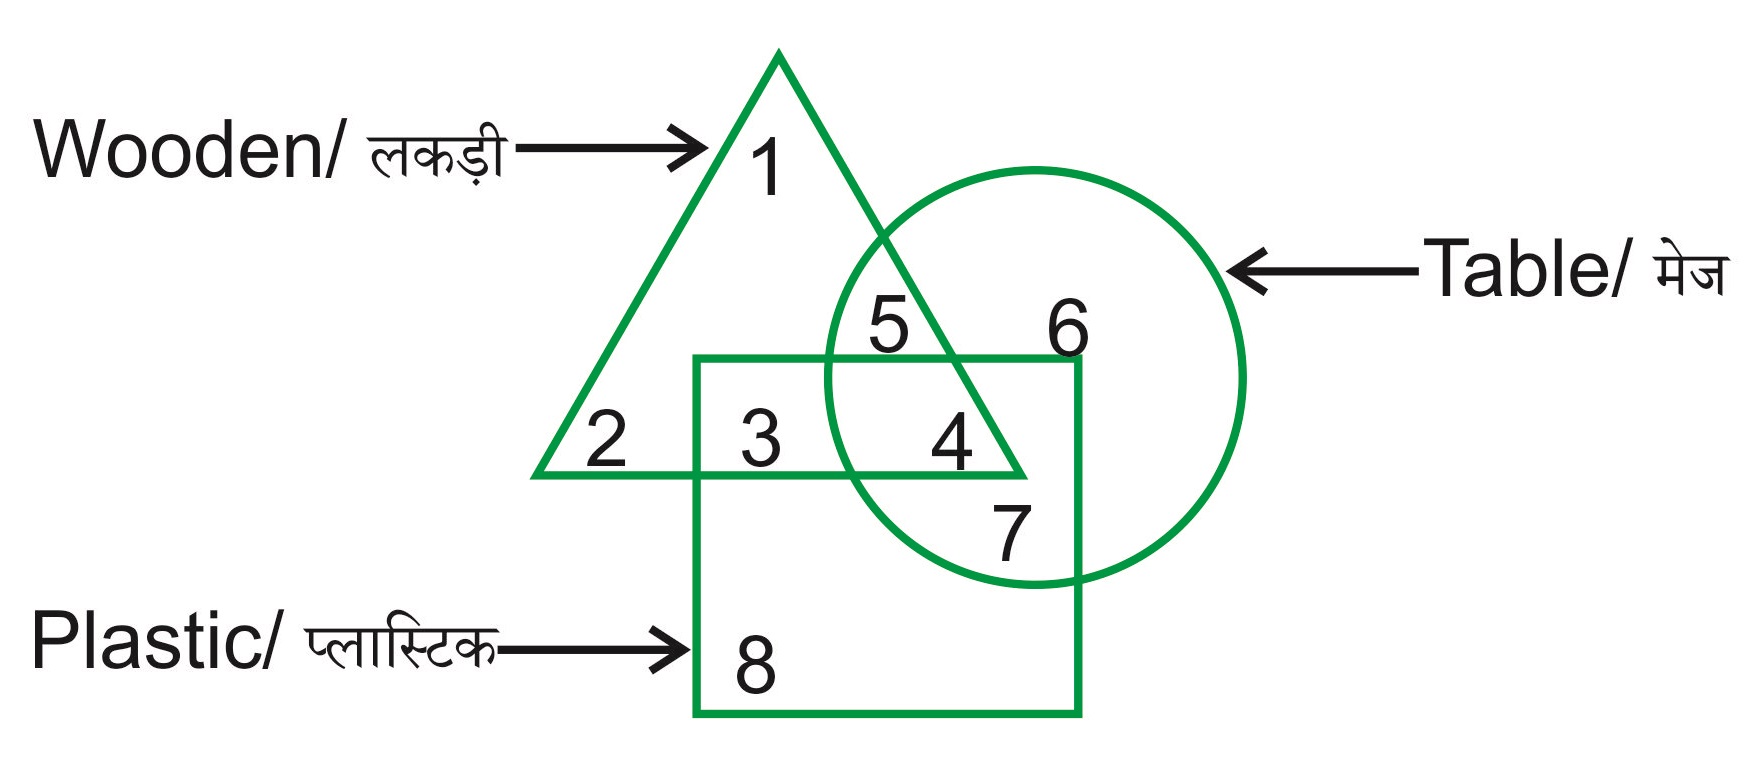
Q: In the given figure, which number represents plastic tablets which are wooden?
2229 05df9eb8c36644b47cbaf2e82
5df9eb8c36644b47cbaf2e82- 13false
- 25false
- 37false
- 44true
- Show AnswerHide Answer
- Workspace
- SingleChoice
Answer : 4. "4"
Q: Identify the diagram that best represents the relationship among the given classes.
Job, Government Job, Private job
2208 05f03ea7e26cfc348bd6b891f
5f03ea7e26cfc348bd6b891f- 1false

- 2false

- 3false

- 4true

- Show AnswerHide Answer
- Workspace
- SingleChoice
Answer : 4. "
"
Q: Which of the following diagrams indicates the best relation between Page, Chapter and Book ?
2149 05ef2cde8bea49d16b478da9e
5ef2cde8bea49d16b478da9e- 1false

- 2false

- 3false

- 4true

- Show AnswerHide Answer
- Workspace
- SingleChoice
Answer : 4. "
"
Q: Which of the following Venn Diagram gives the relationship between Friend, Guide and Philosopher ?
2135 06391c981b13d3250d325d1e0
6391c981b13d3250d325d1e0- 11false
- 22false
- 33true
- 44false
- Show AnswerHide Answer
- Workspace
- SingleChoice
Answer : 3. "3"
Q: Select the venn diagram that best illustrates the relationship between the following classes.
Villagers, Poor Persons, Males
2094 05f5098f57e85226ee7509598
5f5098f57e85226ee7509598- 1false

- 2false
- 3true
- 4false

- Show AnswerHide Answer
- Workspace
- SingleChoice
Answer : 3. "
"
Q:Study the diagram given below and answer each of the following questions.
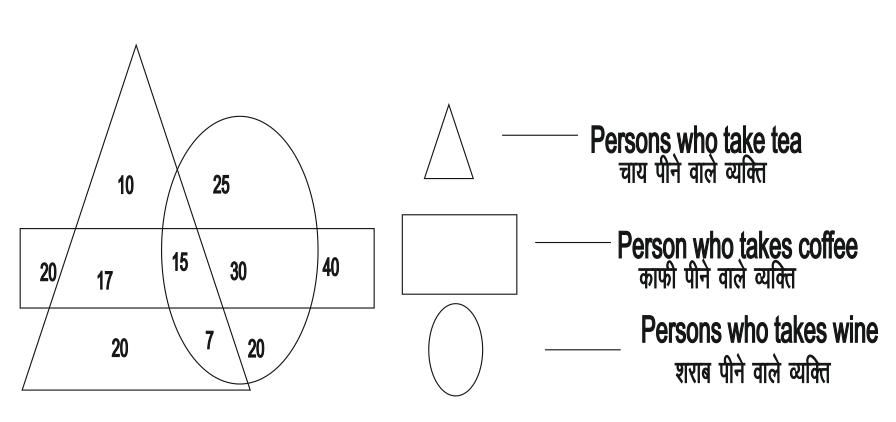
How many persons takes all the three ?
2056 05eec56e61dab100936f00098
5eec56e61dab100936f00098- 120false
- 217false
- 325false
- 415true
- Show AnswerHide Answer
- Workspace
- SingleChoice
Answer : 4. "15"
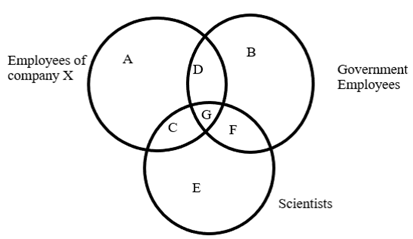
Q: Which of the following does the group C represent in the above diagram?
1989 05d4cf4e985d4e2237b5fdb04
5d4cf4e985d4e2237b5fdb04- 1All such employees of Company X who are also scientists as well as Government employeesfalse
- 2All Such Government employees who are Scientists as well as employees of Company Xfalse
- 3All such employees of Company X who are Scientists but are not Government employeestrue
- 4All such Scientists who are neither Government employees nor employed with Company Xfalse
- 5All such Government employees who are also employed with company Xfalse
- Show AnswerHide Answer
- Workspace
- SingleChoice