Logical Venn Diagrams Practice Question and Answer
8 Q:Direction: Study the following diagram and answer question based on it-
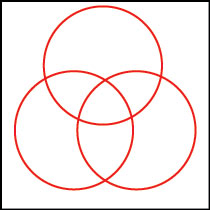
The diagram represents the favourite ice-cream flavours of kids in a society
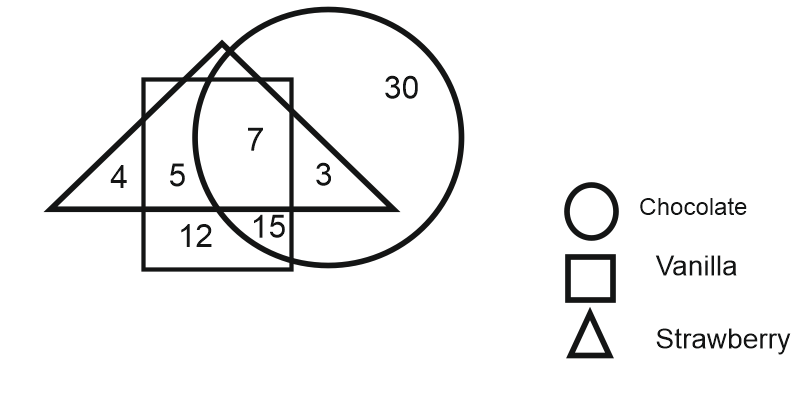
How many kids like strawberry but not vanilla?
1985 05e7c42049b7cd81e41fae756
5e7c42049b7cd81e41fae756- 14false
- 25false
- 37true
- 43false
- Show AnswerHide Answer
- Workspace
- SingleChoice
Answer : 3. "7"
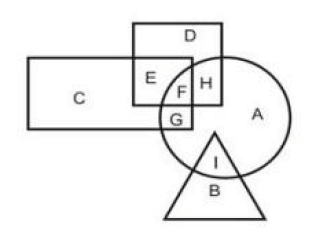
Q: In the following figure, the rectangle represents the artists, the triangle represents the writers, the circle represents the social workers and the square represents the father. Which group of letters represents social workers who are not fathers?
1981 05faba796aa6ba574512ae885
5faba796aa6ba574512ae885- 1GFHfalse
- 2IGFfalse
- 3DEBfalse
- 4GAItrue
- Show AnswerHide Answer
- Workspace
- SingleChoice
Answer : 4. "GAI"
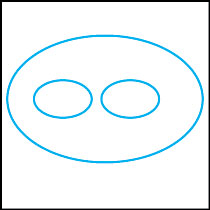
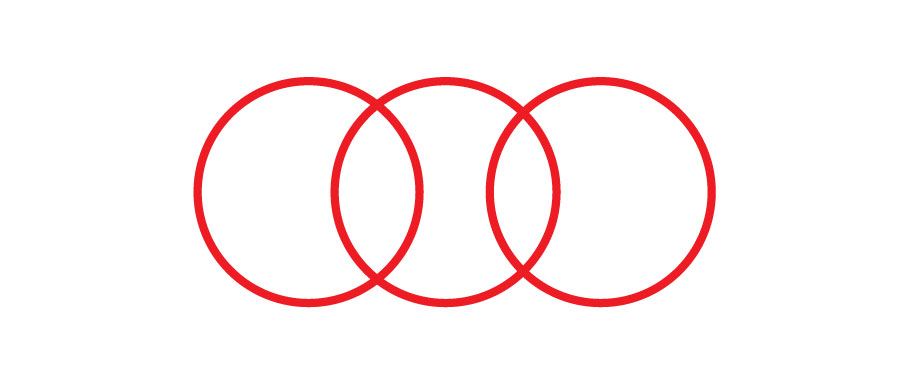
Q:Directions: In each of these questions, three words are related in some way. The relationship among the words in the question can best be represented by one of the five diagrams (a), (b), (c), (d) and (e) given below. Mark your answer accordingly.
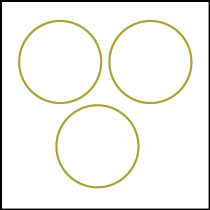
Professor, Birds, Mice
1967 05ee1fee5ef054905196f712b
5ee1fee5ef054905196f712b- 1false

- 2false

- 3false
- 4false

- 5true

- Show AnswerHide Answer
- Workspace
- SingleChoice
Answer : 5. "
"
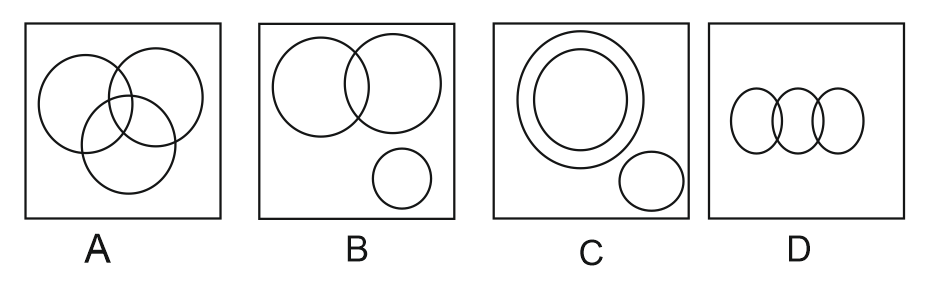
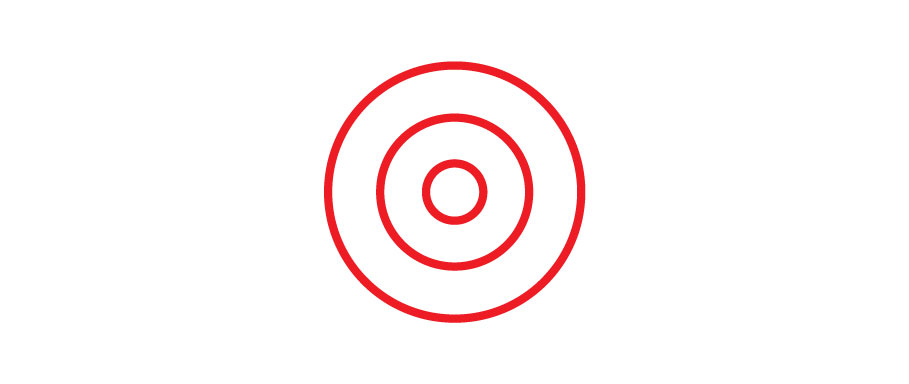
Q: Identify the diagram that best represents the relationship among the given classes.
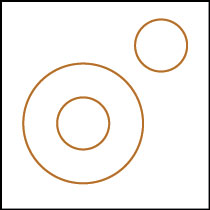
Vegetable, Park, Carrot
1958 05ed761ca22579c390050f60e
5ed761ca22579c390050f60e- 1Ctrue
- 2Afalse
- 3Bfalse
- 4Dfalse
- Show AnswerHide Answer
- Workspace
- SingleChoice
Answer : 1. "C"
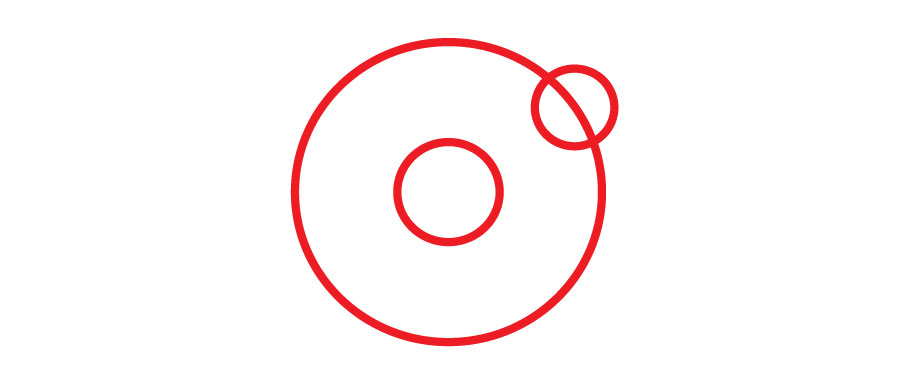
Q:Directions: In each of these questions, three words are related in some way. The relationship among the words in the question can best be represented by one of the five diagrams (a), (b), (c), (d) and (e) given below. Mark your answer accordingly.
Teacher, College, Student
1911 05ec7cad2112c8637e1b4f9be
5ec7cad2112c8637e1b4f9be- 1false
- 2false
- 3true

- 4false
- 5false
- Show AnswerHide Answer
- Workspace
- SingleChoice
Answer : 3. "
"
Q:Study the following figure and answer the following questions.
1. Here the big triangle shows the artists.
2.Short represents triangular scientists.
3. The square refers to dancers.
4.The Circle refers to the doctors.
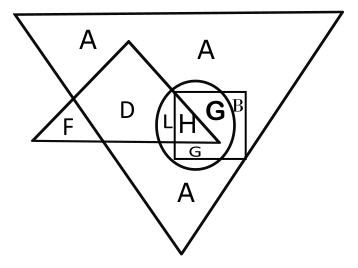
Which letter represents artists who are neither doctors, nor scientists nor dancers?
1906 05f3cc69e069d3f5fd51d0248
5f3cc69e069d3f5fd51d0248- 1Dfalse
- 2Ffalse
- 3Atrue
- 4Gfalse
- Show AnswerHide Answer
- Workspace
- SingleChoice
Answer : 3. "A"
Q:Study the diagram given below and answer each of the following questions.
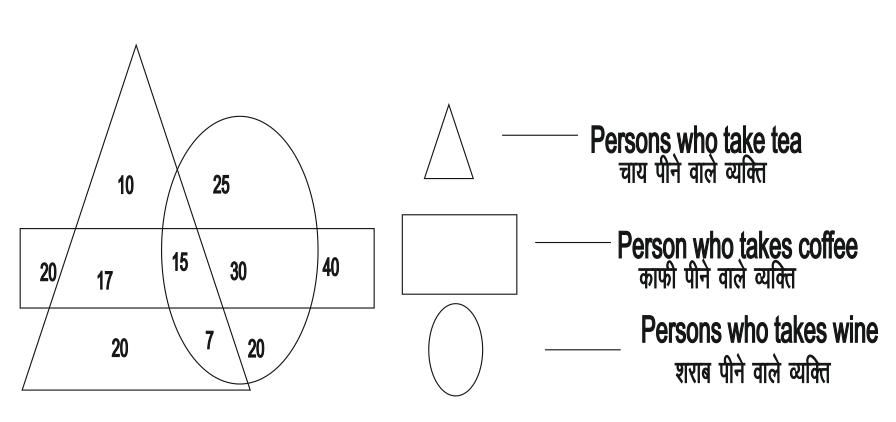
How many persons take wine?
1862 05eec55baeee45c3b837ed05d
5eec55baeee45c3b837ed05d- 1100false
- 282false
- 392false
- 4122true
- Show AnswerHide Answer
- Workspace
- SingleChoice
Answer : 4. "122"
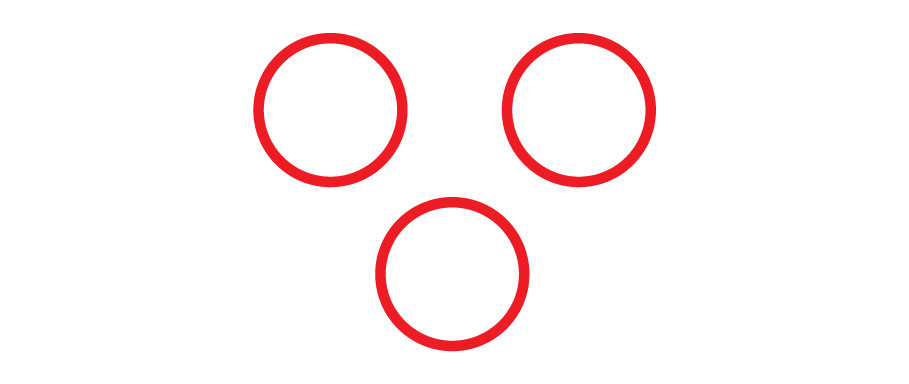
Q: Find out which of the diagrams given in the alternatives correctly represent the relationship stated in the question.
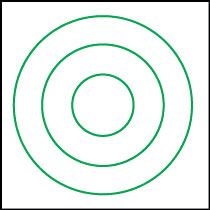
Sharks, Whales, Turtles.
1854 05ebb94cac1aae5429b39550c
5ebb94cac1aae5429b39550cSharks, Whales, Turtles.
- 1false
- 2false
- 3true
- 4false
- Show AnswerHide Answer
- Workspace
- SingleChoice
Answer : 3. "
"