Statistics and Data Analysis Practice Question and Answer
8 Q: The mode and median of the data 8, 6, 8, 7, 8, 6, 8, 7, 6 is
2130 05e7c3a457af3db16e180d8c9
5e7c3a457af3db16e180d8c9- 17 and 8false
- 26 and 7false
- 38 and 7true
- 46 and 8false
- Show AnswerHide Answer
- Workspace
- SingleChoice
Answer : 3. "8 and 7"
Q: The median of the number 14, 12, 12, 16, 13 and 18 is:
1898 05dba665aa263e637857548fd
5dba665aa263e637857548fd- 113false
- 214false
- 314.5false
- 413.5true
- Show AnswerHide Answer
- Workspace
- SingleChoice
Answer : 4. "13.5"
Q: Runs scored by Rohit sharma in some 3 test Matches against Pakastian are as follows 101, 126, 32, 38, 52, and 40. Find median of the given scores.
1705 05f8930aff28f4b47be2cbc51
5f8930aff28f4b47be2cbc51- 146true
- 246.5false
- 350false
- 447false
- Show AnswerHide Answer
- Workspace
- SingleChoice
Answer : 1. "46"
Q:The distribution of fruit consumption in a sample of 72 seventeen – year – old girls is given in the graph below. Study the graph and answer the questions.
Distribution of Fruit Consumption
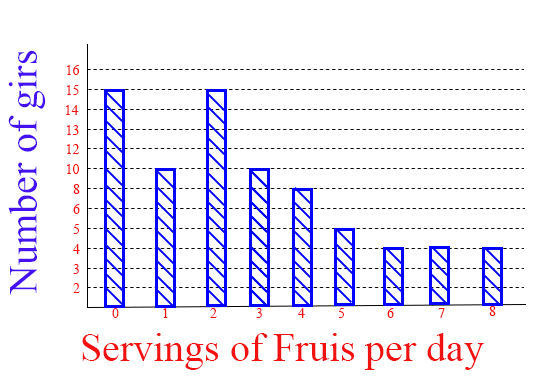
How many of these girls ate fewer than two servings per day?
1155 05d92ca6dbc45ad7944d994e9
5d92ca6dbc45ad7944d994e9- 115false
- 240false
- 325true
- 4None of thesefalse
- Show AnswerHide Answer
- Workspace
- SingleChoice
Answer : 3. "25"
Q: The mean of four different observations is 17.5. When a new observation whose value 20 is added, what will be the new mean?
1133 05eb4ec82336570304e1983e7
5eb4ec82336570304e1983e7- 118true
- 217.5false
- 319false
- 418.5false
- Show AnswerHide Answer
- Workspace
- SingleChoice
Answer : 1. "18"
Q:The distribution of fruit consumption in a sample of 72 seventeen – year – old girls is given in the graph below. Study the graph and answer the questions.
Distribution of Fruit Consumption
What percent of these girls ate six or more servings per day
941 05d92caf86819c079458b781c
5d92caf86819c079458b781c- 112.5%true
- 213%false
- 310%false
- 411%false
- Show AnswerHide Answer
- Workspace
- SingleChoice
Answer : 1. "12.5%"
Q:The distribution of fruit consumption in a sample of 72 seventeen – year – old girls is given in the graph below. Study the graph and answer the questions.
Distribution of Fruit Consumption
How many of these girls ate more than tow serving but less than six serving per day?
920 05d92d8ed9fdacf79284440f0
5d92d8ed9fdacf79284440f0- 126false
- 218false
- 323true
- 438false
- Show AnswerHide Answer
- Workspace
- SingleChoice
Answer : 3. "23"
Q: The heights of Arun’s family members are given in cm’s as 165, 180, 181, 163, 172, 180, 162 The median height of the family will be
911 05ef04b27f18fb82abc773d85
5ef04b27f18fb82abc773d85- 1172true
- 2170false
- 3131false
- 4167false
- Show AnswerHide Answer
- Workspace
- SingleChoice