Data Interpretation Questions Practice Question and Answer
8 Q:Directions : Given here is a pie chart showing the cost of gold in 2010, 2011, 2012 and 2013. Study the chart and answer the following questions
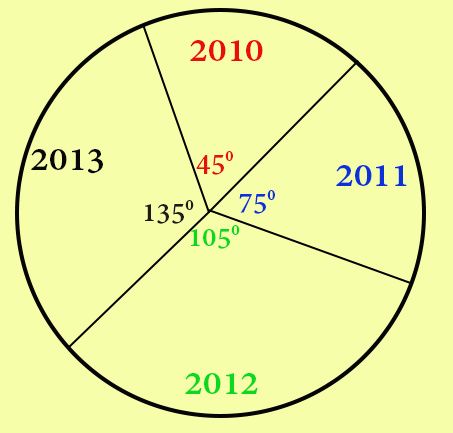
The ratio of the price of gold in the two years 2010 and 2013 is
1314 064539d6f13eb5908ae3544d5
64539d6f13eb5908ae3544d5- 11 : 2false
- 21 : 3true
- 31 : 4false
- 41 : 5false
- Show AnswerHide Answer
- Workspace
- SingleChoice
Answer : 2. "1 : 3"
Q:Direction: Read the following graph carefully and answer the following questions:
The following bar graph shows the quantity(in kg) of wheat, rice, pulses and salts sold by two companies P and Q in the month of January.
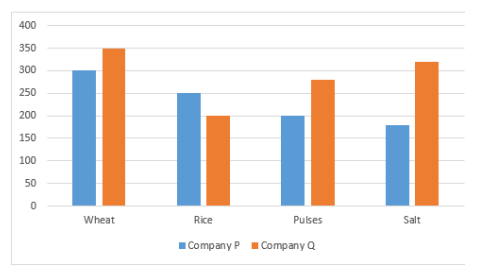
The quantity(in kg) of wheat, rice, pulses and salts sold by two companies P and Q together in the month of February is 12.5% more than the total quantities sold by two companies P and Q together in the month of January. Find the total quantities of all the four items sold in the month of February.
1461 064ddf5b474cca4494978aed5
64ddf5b474cca4494978aed5The following bar graph shows the quantity(in kg) of wheat, rice, pulses and salts sold by two companies P and Q in the month of January.
- 12340 kgtrue
- 22500 kgfalse
- 32750 kgfalse
- 42330 kgfalse
- 52440 kgfalse
- Show AnswerHide Answer
- Workspace
- SingleChoice
Answer : 1. "2340 kg "
Q:Directions: Read the given pie and table carefully and answer the following questions.
The pie chart shows the percentage distribution of people who found COVID – 19 positive in four major cities of India from 1st July to 31st August 2020 and the table shows the number of people who tested positive in July from these cities.
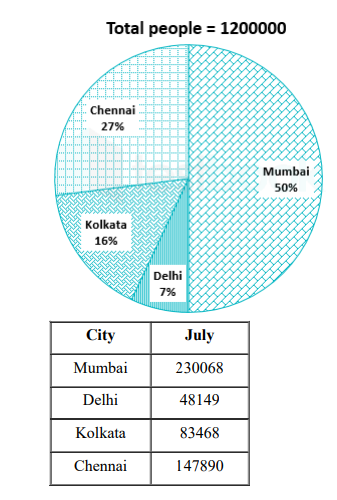
Total numbers of cases in July are how much more or less than the total number of cases in August of all four cities?
1371 064f5673a2bbb242750e8a25c
64f5673a2bbb242750e8a25c- 1509575false
- 2690425false
- 3180850true
- 4245689false
- 5None of thesefalse
- Show AnswerHide Answer
- Workspace
- SingleChoice
Answer : 3. "180850"
Q:Directions: Read the given pie and table carefully and answer the following questions.
The pie chart shows the percentage distribution of people who found COVID – 19 positive in four major cities of India from 1st July to 31st August 2020 and the table shows the number of people who tested positive in July from these cities.
What is the average of the number of people in August from Mumbai and the number of people in July from Chennai who tested positive?
1334 064f566a7a1e68c7201ab110d
64f566a7a1e68c7201ab110d- 1258911true
- 2324526false
- 3242478false
- 4278562false
- 5None of thesefalse
- Show AnswerHide Answer
- Workspace
- SingleChoice
Answer : 1. "258911"
Q:Directions: Read the given pie and table carefully and answer the following questions.
The pie chart shows the percentage distribution of people who found COVID – 19 positive in four major cities of India from 1st July to 31st August 2020 and the table shows the number of people who tested positive in July from these cities.
If the recovery rate is 70% and the death rate is 10% of total tested cases in Chennai at the end of July. How many active cases are on 1st August, if no case is found on that day?
1222 064f567f490902899fbf4746e
64f567f490902899fbf4746e- 132593false
- 221500false
- 315320false
- 429578true
- 5None of thesefalse
- Show AnswerHide Answer
- Workspace
- SingleChoice
Answer : 4. "29578"
Q:Directions: Read the given pie and table carefully and answer the following questions.
The pie chart shows the percentage distribution of people who found COVID – 19 positive in four major cities of India from 1st July to 31st August 2020 and the table shows the number of people who tested positive in July from these cities.
Total peoples tested positive in Delhi is what percent of the total number of people tested positive in Mumbai?
1246 064f567912bbb242750e8a3fd
64f567912bbb242750e8a3fd- 111%false
- 214%true
- 316%false
- 418%false
- 519%false
- Show AnswerHide Answer
- Workspace
- SingleChoice
Answer : 2. "14%"
Q:Directions: Read the given pie and table carefully and answer the following questions.
The pie chart shows the percentage distribution of people who found COVID – 19 positive in four major cities of India from 1st July to 31st August 2020 and the table shows the number of people who tested positive in July from these cities.
Number of people from Delhi who tested positive in July is what percent of total positive tested people of that city?
1246 064f5664c90902899fbf4708e
64f5664c90902899fbf4708e- 156%false
- 257.32%true
- 362.58%false
- 460%false
- 559.86%false
- Show AnswerHide Answer
- Workspace
- SingleChoice
Answer : 2. "57.32%"
Q:Directions: Read the pie chart carefully and answer the following questions.
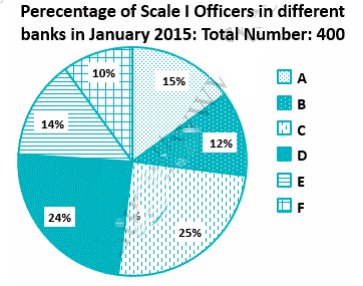
Note: No new employees joined the given banks of left the given banks from January 2015 to December 2015.
In January 2016, some Scale I Officers resigned from Bank C and all of them joined Bank B. If the resultant respective ratio between the number of Scale I Officers in Bank C and that in Bank B is 24 : 13, what is the number of Scale I Officers who resigned from Bank C?
1171 064f1e0103be218b6cde4ef0a
64f1e0103be218b6cde4ef0a- 13false
- 26false
- 37false
- 44true
- 55false
- Show AnswerHide Answer
- Workspace
- SingleChoice