Join Examsbook
Total numbers of cases in July are how much more or less than the total number of cases in August of all four cities?
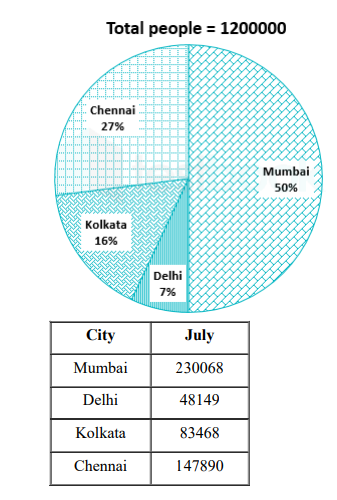
5Directions: Read the given pie and table carefully and answer the following questions.
The pie chart shows the percentage distribution of people who found COVID – 19 positive in four major cities of India from 1st July to 31st August 2020 and the table shows the number of people who tested positive in July from these cities.
Q:
Total numbers of cases in July are how much more or less than the total number of cases in August of all four cities?
- 1509575false
- 2690425false
- 3180850true
- 4245689false
- 5None of thesefalse
- Show AnswerHide Answer
- Workspace