Data Interpretation Questions Practice Question and Answer
8 Q:Directions : Given here is a pie chart showing the cost of gold in 2010, 2011, 2012 and 2013. Study the chart and answer the following questions
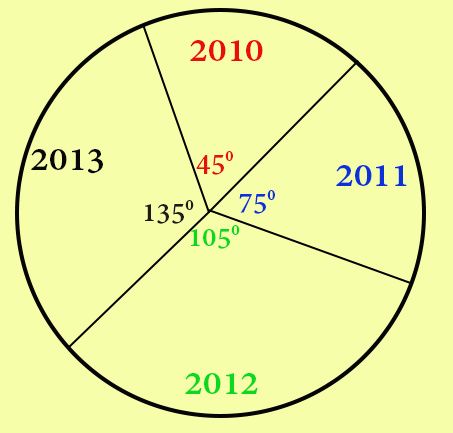
The ratio of percentage increases in price of gold from 2011 to 2012 and 2012 to 2013 is
802 064539f4739143d085f3e3c04
64539f4739143d085f3e3c04- 16 : 5false
- 27 : 5true
- 38 : 5false
- 49 : 5false
- Show AnswerHide Answer
- Workspace
- SingleChoice
Answer : 2. "7 : 5"
Q:Directions : Given here is a pie chart showing the cost of gold in 2010, 2011, 2012 and 2013. Study the chart and answer the following questions
The percentage increase in the price of gold from the year 2011 to 2013 is
976 064539e95f3618908bf5e0c4e
64539e95f3618908bf5e0c4e- 150%false
- 260%false
- 370%false
- 480%true
- Show AnswerHide Answer
- Workspace
- SingleChoice
Answer : 4. "80%"
Q:Directions : Given here is a pie chart showing the cost of gold in 2010, 2011, 2012 and 2013. Study the chart and answer the following questions
If the price of gold in 2013 is Rs. 31,500 per 10 gram, then the price of gold in 2011 per 10 gram is
978 064539c6813eb5908ae354318
64539c6813eb5908ae354318- 1Rs. 17000false
- 2Rs. 17500true
- 3Rs. 18000false
- 4Rs. 18500false
- Show AnswerHide Answer
- Workspace
- SingleChoice
Answer : 2. "Rs. 17500"
Q: The bar graph given below shows the sales of books (in thousand number) from six branches - B1, B2, B3, B4 , B5 and B6 of a publishing company during two consecutive years 2000 and 2001.
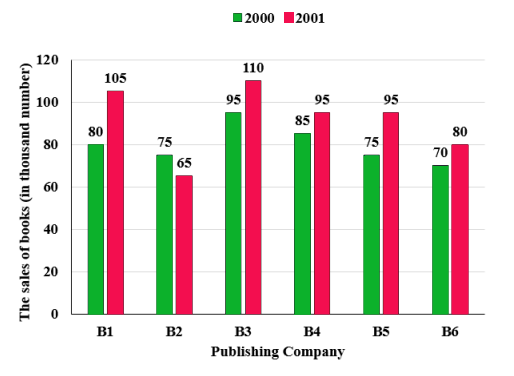
Find the percentage (approximate) of the average sales of branches B2, B4 and B6 in the year 2001 to the average sales of branches B1, B3 and B5 in the year 2001.
1991 06450e07f39143d085f375b8b
6450e07f39143d085f375b8b- 197.95%false
- 282.26%false
- 377.42%true
- 492%false
- Show AnswerHide Answer
- Workspace
- SingleChoice
Answer : 3. "77.42% "
Q: The following histogram shows the height of players of a basketball team of a school.
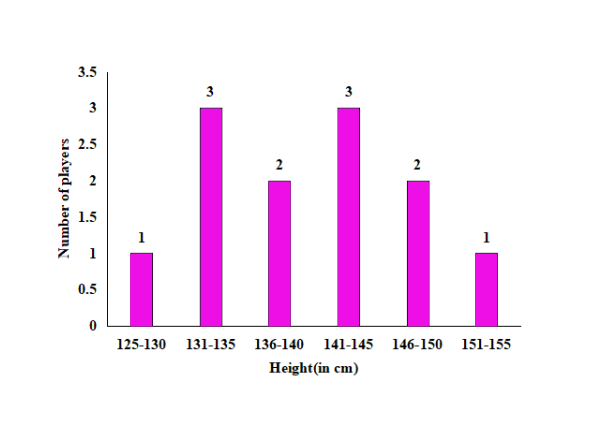
How many players have height less than 141 cm?
1403 06450d85b39143d085f373d2e
6450d85b39143d085f373d2e- 17false
- 24false
- 36true
- 45false
- Show AnswerHide Answer
- Workspace
- SingleChoice
Answer : 3. "6"
Q: The bar graph shows the number of passports issued in a country in 6 consecutive years.
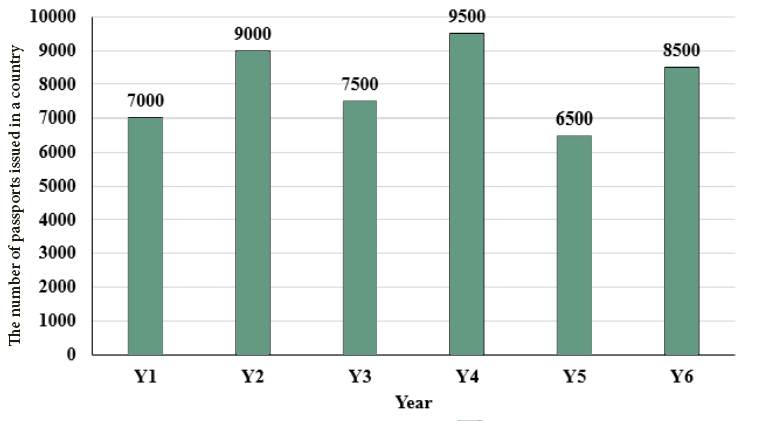
What is the average number of passports issued per year?
1346 06450cd6139143d085f370f7d
6450cd6139143d085f370f7d- 111200false
- 27600false
- 38000true
- 412000false
- Show AnswerHide Answer
- Workspace
- SingleChoice
Answer : 3. "8000 "
Q: The table given below shows the cost price and selling price of four articles.
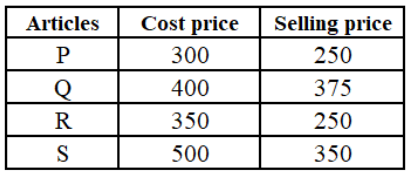
What is the average value of loss of all articles?
1419 06450b2a7f3618908bf57165d
6450b2a7f3618908bf57165d- 160.75false
- 295.55false
- 381.25true
- 472.24false
- Show AnswerHide Answer
- Workspace
- SingleChoice
Answer : 3. "81.25 "
Q: The bar graph given below shows the production of sugar (in lakh tonnes) by two different companies P and Q for the given years.
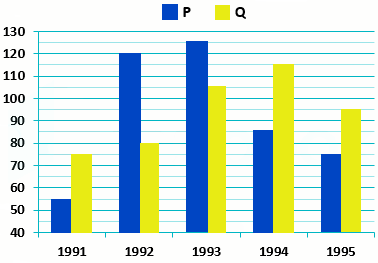
J1 = percentage increase in production of sugar of company P from 1991 to 1995.
J2 = percentage increase in production of sugar of company Q from 1992 to 1994.
What is the value of J1 + J2?
2015 06450ab5b13eb5908ae2dc657
6450ab5b13eb5908ae2dc657- 148 percentfalse
- 280.11 percenttrue
- 386.22 percentfalse
- 476.11 percentfalse
- Show AnswerHide Answer
- Workspace
- SingleChoice