Data Interpretation Questions Practice Question and Answer
8 Q: The bar chart given below shows the number of tea packets of 2 varieties sold by 5 shops during a particular week.

What is the average number of tea packets sold per shop, both the varieties take together?
1068 0642ac307dcb650c14576f3db
642ac307dcb650c14576f3db- 1154.4true
- 2152.8false
- 3157.6false
- 4149.2false
- Show AnswerHide Answer
- Workspace
- SingleChoice
Answer : 1. "154.4 "
Q: The following table shows the number of laptops sold from five different stores in a city on five days of a given week.
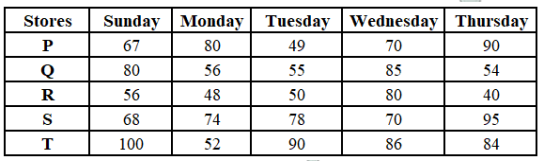
What is the ratio of the total number of computers sold from store S on Tuesday, Monday and Sunday taken together to that sold from store P on Tuesday, Wednesday and Thursday taken together?
1136 0642824fcdcb650c14572115f
642824fcdcb650c14572115f- 113 : 11false
- 211 : 15false
- 311 : 19false
- 420 : 19true
- Show AnswerHide Answer
- Workspace
- SingleChoice
Answer : 4. "20 : 19"
Q: Study the given pie-chart and answer the question that follows.
The pie-chart shows the percentage distribution of the number of different types of chocolates distributed by Akanksha to the residents of a children's home, as percentages of all the chocolates taken together, that were distributed by her to these residents.
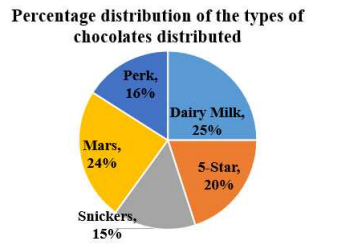
The average number of chocolates of Dairy Milk, 5-Star and Snickers taken together is equal to the number of chocolates distributed of which of the given types?
1462 0642814547ac9a186e4e0489f
642814547ac9a186e4e0489f- 15-Startrue
- 2Daily Milkfalse
- 3Perkfalse
- 4Marsfalse
- Show AnswerHide Answer
- Workspace
- SingleChoice
Answer : 1. "5-Star"
Q: The following bar graph shows the number of students who like four different colours.
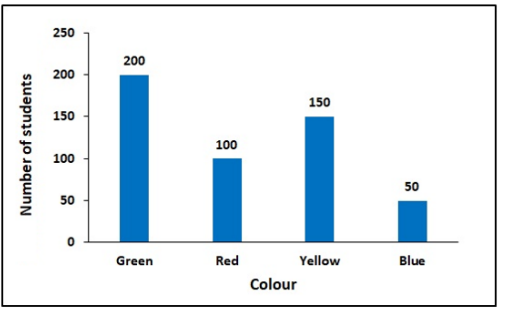
Find the difference between the number of students who like yellow and those who liked blue. 1377 0642812ae32185cce37155b84
642812ae32185cce37155b84- 1100true
- 2125false
- 350false
- 460false
- Show AnswerHide Answer
- Workspace
- SingleChoice
Answer : 1. "100"
Q: The table below gives the ranks secured by five different students in three different subjects in a qualifying examination:
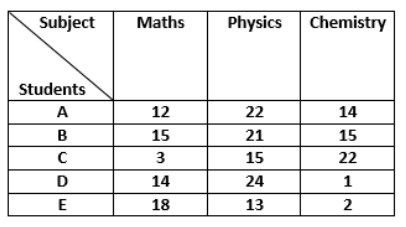
Find the positive difference between the ranks secured by A in Physics and in Maths.
1014 06426e16c32185cce37134f5f
6426e16c32185cce37134f5f- 125false
- 210true
- 315false
- 420false
- Show AnswerHide Answer
- Workspace
- SingleChoice
Answer : 2. "10"
Q: The following pie chart shows the sectors representing the shares of the number of electric buses manufactured in each of 7 different colours in a given year in terms of the central angles (in degrees) with respect to the total number of buses manufactured during that year of all the 7 colours taken together.
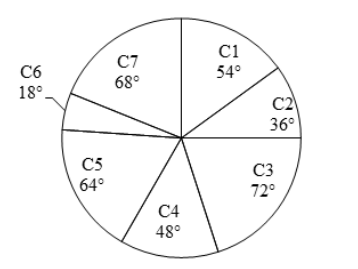
What is the difference in the percentage shares of buses of C4 and C6? [Give your answer correct to 2 decimal places.]
1369 06426e077ed76c064b85c7dd0
6426e077ed76c064b85c7dd0- 111.11%false
- 28.33 %true
- 39.09 %false
- 412.5 %false
- Show AnswerHide Answer
- Workspace
- SingleChoice
Answer : 2. "8.33 %"
Q: The bar chart given below shows the exports (in ₹000) and imports (in ₹000) of a country for 5 consecutive years.
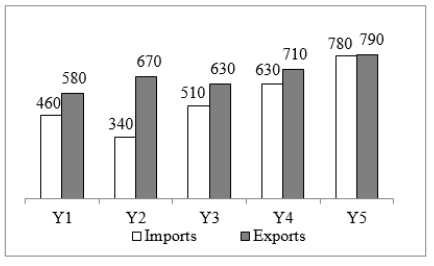
What is the positive difference in the total export figures of all the five years taken together and the total import figures of all the five years taken together?
1587 06426dfdc7ac9a186e4de97d7
6426dfdc7ac9a186e4de97d7- 1₹6,20,000false
- 2₹5,40,000false
- 3₹5,80,000false
- 4₹6,60,000true
- Show AnswerHide Answer
- Workspace
- SingleChoice
Answer : 4. "₹6,60,000"
Q: The following bar chart shows the exports (in ₹'0000) of an item from a country 5 consecutive years.
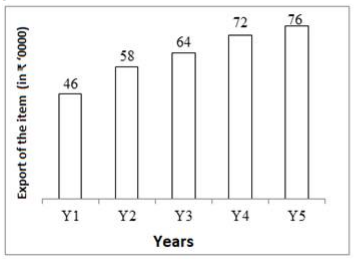
What is the average value of the export of that item from the given country per year?
1204 06422531432185cce370793c0
6422531432185cce370793c0- 1₹5,96,000false
- 2₹6,32,000true
- 3₹6,24,000false
- 4₹6,48,000false
- Show AnswerHide Answer
- Workspace
- SingleChoice