Data Interpretation Questions Practice Question and Answer
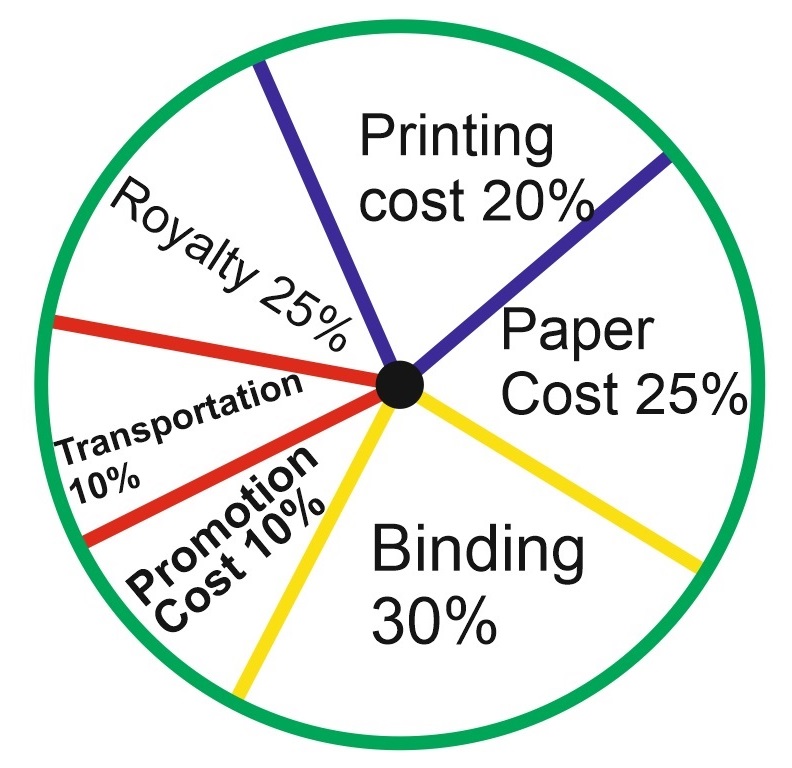
8 Q: Which two expenditures together have a central angle of 108°?
1839 05d70c54ed8eebc768d114011
5d70c54ed8eebc768d114011
- 1Binding Cost and Transportation Costtrue
- 2Printing Cost and Paper Costfalse
- 3Royalty and Promotion Costfalse
- 4Binding Cost and Paper Costfalse
- Show AnswerHide Answer
- Workspace
- SingleChoice
Answer : 1. "Binding Cost and Transportation Cost"
Explanation :
Central angle of 1080 = ![]() of the total expenditure= 30% of the total expenditure.
of the total expenditure= 30% of the total expenditure.
From the pie – chart it is clear that:
Binding Cost + Transportation Cost = (20% + 10%) of the total expenditure
= 30% of the total expenditure
⸫ Binding Cost and Transportation Cost together have a central angle of 1080.
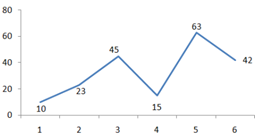
Q: This line graph shows the scores of a batsman in 6 consecutive matches. What is the range of his scores?
1820 060c09971c197293a4827413d
60c09971c197293a4827413d- 153true
- 243false
- 341false
- 451false
- Show AnswerHide Answer
- Workspace
- SingleChoice
Answer : 1. "53"
Q:Directions : Given line graph shows the data of male & female population in 5 different cities. Read the data carefully and answer the questions.
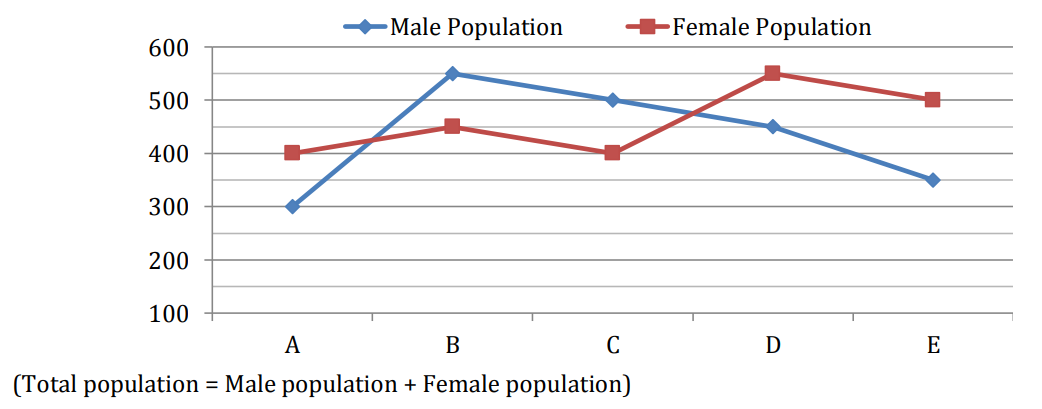
If in city A, the ratio of male graduates to female graduates is 3 : 4 and total graduates in the city are 70% of total population. Find population of females who are not graduate.
1815 060408834e759ac364c93f3c5
60408834e759ac364c93f3c5- 1120true
- 250false
- 390false
- 470false
- 5135false
- Show AnswerHide Answer
- Workspace
- SingleChoice
Answer : 1. "120"
Q:Direction: Study the following table carefully to answer these questions.
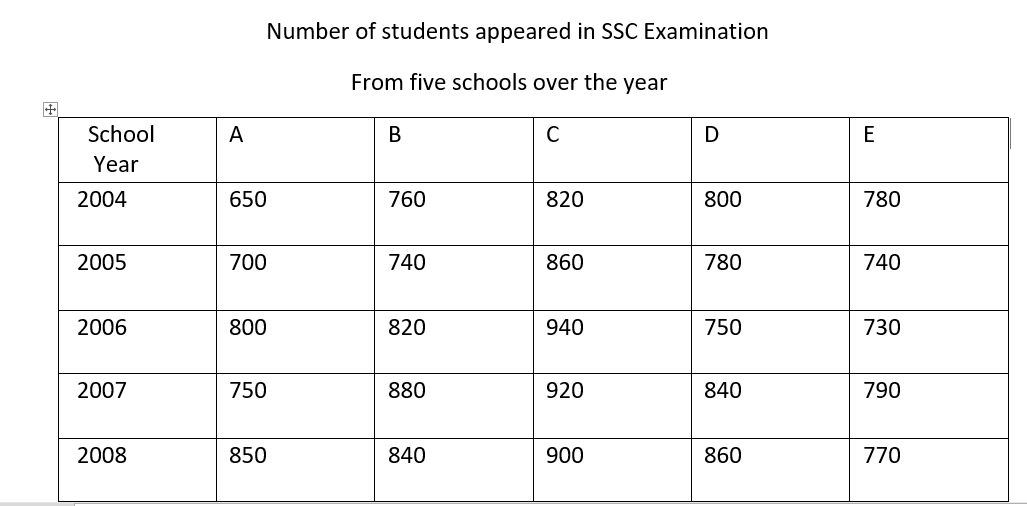
Number of students appeared from school E in 2004 is approximately what per cent of the total number of students appeared from all the schools together in that year?
1809 05e6c66c70b8b1e6afc2ac73d
5e6c66c70b8b1e6afc2ac73d- 112false
- 228false
- 315false
- 430false
- 520true
- Show AnswerHide Answer
- Workspace
- SingleChoice
Answer : 5. "20"
Q:Directions: The following pie-chart represents the result of 600 successful students in various subject of an examination. Study the Pie-chart and answer question.
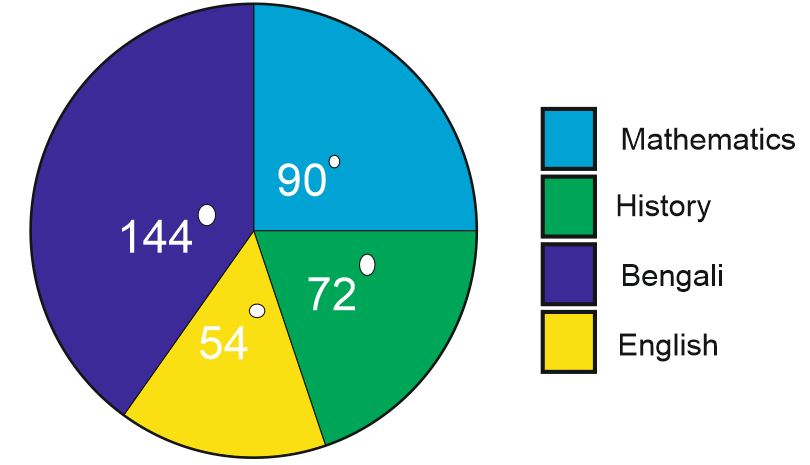
The number of students passed in English is less than the number of students passed in Mathematics by
1803 05ee301b7f72c0e153c805ae4
5ee301b7f72c0e153c805ae4- 150false
- 260true
- 390false
- 475false
- Show AnswerHide Answer
- Workspace
- SingleChoice
Answer : 2. "60"
Q:The following pie-chart shows the monthly expenditure of family on various items. If the family spends Rs. 825 on clothing answer the question
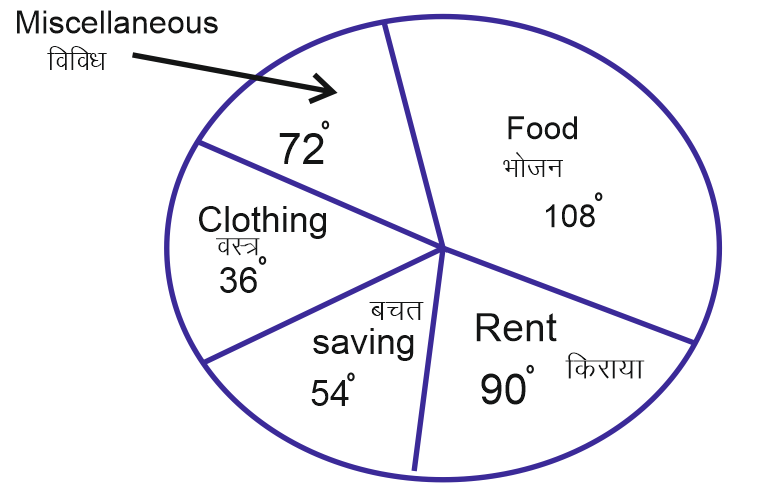
What is the total monthly income of the family?
1802 05de4e10f76066724df64c2c8
5de4e10f76066724df64c2c8- 1Rs. 8025false
- 2Rs. 8520false
- 3Rs. 8250true
- 4Rs. 8052/false
- Show AnswerHide Answer
- Workspace
- SingleChoice
Answer : 3. "Rs. 8250"
Q:Directions: Study the following table carefully to answer the questions that follow .
Number of soldiers ( in thousands ) joining five different forces during six different.
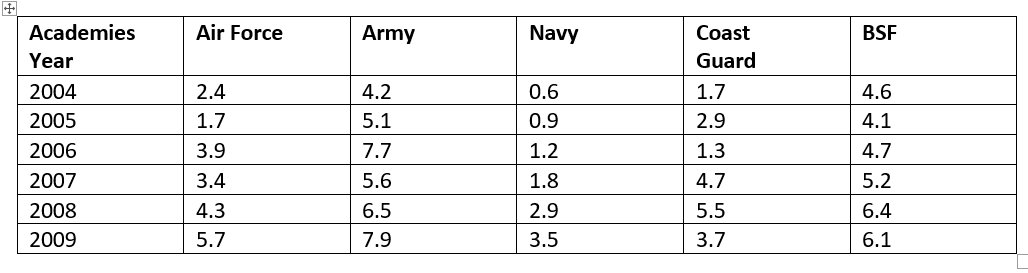
What is the difference between the total number of soldiers joining Air force in the year 2004, 2005 and 2008 and the number of Soldiers joining Army in the year 2008?
1787 05e82e9a9a03c856bcca7f714
5e82e9a9a03c856bcca7f714Number of soldiers ( in thousands ) joining five different forces during six different.
- 11,700false
- 21,900false
- 31,850false
- 41,920false
- 5None of thesetrue
- Show AnswerHide Answer
- Workspace
- SingleChoice
Answer : 5. "None of these "
Q: The following table shows the number of pens and the number of erasers of 6 different colours that were sold from a stationery store during a given week.
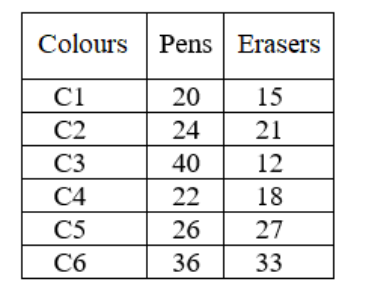
The total number of erasers having colours C3 or C4 is approximately what percentage of the average number of pens of each colour?
1779 064225b265bff3d098d0b9922
64225b265bff3d098d0b9922- 1119.16%false
- 2107.14%true
- 3115.22%false
- 4101.24%false
- Show AnswerHide Answer
- Workspace
- SingleChoice