Data Interpretation Questions Practice Question and Answer
8 Q:Direction: Study the following graph and answer the given question.
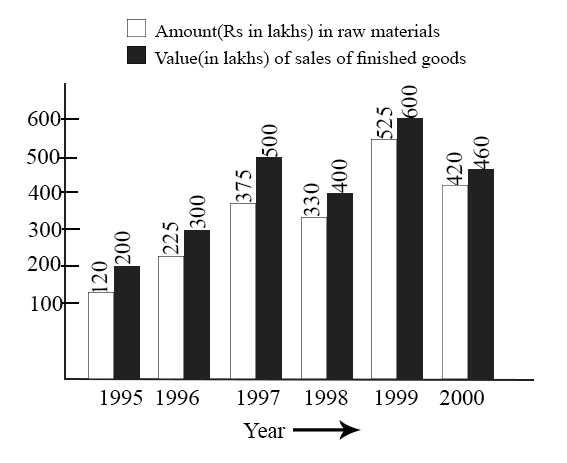
What was the difference between the average amount invested in raw materials during the given period and the average value of sales of finished goods during this period?
1403 05d9daefa82ff737fd6a8362d
5d9daefa82ff737fd6a8362d- 1Rs. 62.5 lakhfalse
- 2Rs. 68.5 lakhfalse
- 3Rs. 71.5 lakhfalse
- 4Rs. 77.5 lakhtrue
- Show AnswerHide Answer
- Workspace
- SingleChoice
Answer : 4. "Rs. 77.5 lakh"
Q:Directions: Student’s strength of a college in Arts, Science and Commerce from 2004-05 to 2007- 08 sessions are shown in the following bar graph. Study the graph and answer the questions
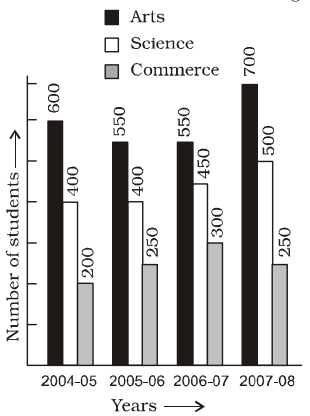
The % increase in science students in 2007-08 over 2006-07 was
909 063f35cc00fa4111f87f087c0
63f35cc00fa4111f87f087c0- 110.1%false
- 211.1%true
- 316.7%false
- 418.2%false
- Show AnswerHide Answer
- Workspace
- SingleChoice
Answer : 2. "11.1% "
Q:Directions: Student’s strength of a college in Arts, Science and Commerce from 2004-05 to 2007- 08 sessions are shown in the following bar graph. Study the graph and answer the questions
The ratio of average number of students in Arts to the average number of students in Commerce is
851 063f35c75aa2a114c952ed6bb
63f35c75aa2a114c952ed6bb- 112 : 5true
- 210 : 7false
- 37 : 4false
- 448 : 35false
- Show AnswerHide Answer
- Workspace
- SingleChoice
Answer : 1. "12 : 5 "
Q: Given is a line graph showing the number of accidents in a city during the first 6 months of 1999.

The decrease % of accidents from May to June is
1090 063ee1dc6b0030e718d806138
63ee1dc6b0030e718d806138- 1$$15{3\over8}\% $$false
- 2$$15{1\over8}\% $$false
- 3$$15{5\over8}\% $$true
- 4$$15{7\over8}\% $$false
- Show AnswerHide Answer
- Workspace
- SingleChoice
Answer : 3. " $$15{5\over8}\% $$"
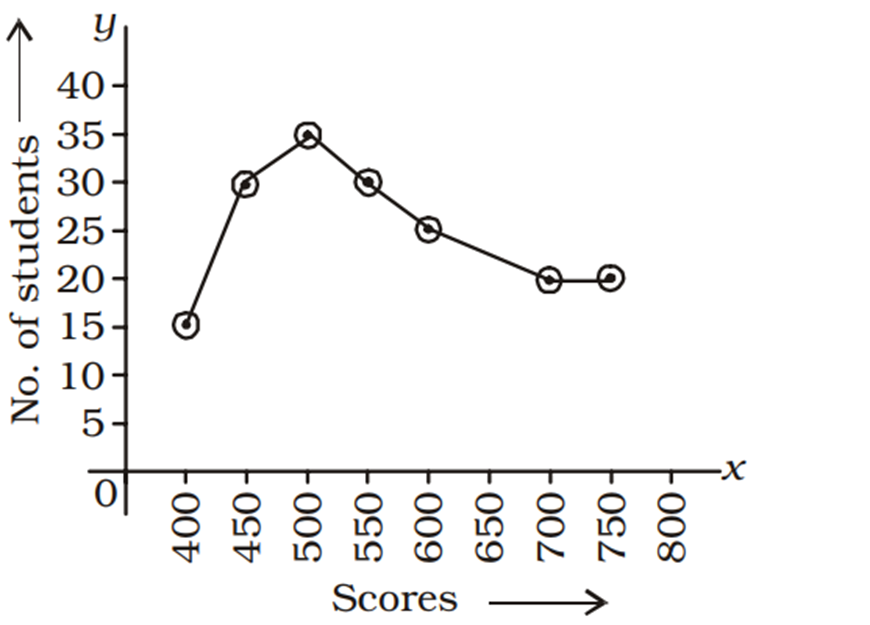
Q: The adjoining diagram is frequency polygon for the scores of students in a test.
What is the total number of students appeared in the test?
1001 063ee1c6a7312b71d33e2f206
63ee1c6a7312b71d33e2f206What is the total number of students appeared in the test?
- 1180true
- 2200false
- 3250false
- 4150false
- Show AnswerHide Answer
- Workspace
- SingleChoice
Answer : 1. "180 "
Q:Directions: Following is the pie-chart showing the spending of a family on various items in a particular year
Study the pie chart and answer questions
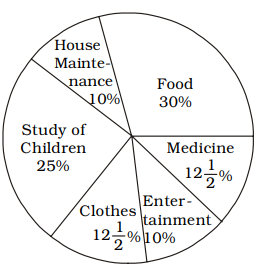
If the difference in the amount spent for buying clothes and house maintenance was ₹ 1,500, how much they spent for house maintenance?
1417 063be706261d62119f1dbc6fa
63be706261d62119f1dbc6fa- 1₹ 5,000false
- 2₹ 6,000true
- 3₹ 7,000false
- 4₹ 8,000false
- Show AnswerHide Answer
- Workspace
- SingleChoice
Answer : 2. "₹ 6,000 "
Q:Directions: Following is the pie-chart showing the spending of a family on various items in a particular year
Study the pie chart and answer questions
Angle of the pie chart representing the expenditure on entertainment is
1018 063be702174eba5069d517362
63be702174eba5069d517362- 115°false
- 210°false
- 336°true
- 426°false
- Show AnswerHide Answer
- Workspace
- SingleChoice
Answer : 3. "36°"
Q:Directions: Following is the pie-chart showing the spending of a family on various items in a particular year
Study the pie chart and answer questions
If the total amount spent on the family during the year was ₹ 35,000, the amount spent for study of children and food together was
991 063be6fa261d62119f1dbc4a2
63be6fa261d62119f1dbc4a2- 119,250true
- 219,500false
- 319,750false
- 419,850false
- Show AnswerHide Answer
- Workspace
- SingleChoice