Data Interpretation Questions Practice Question and Answer
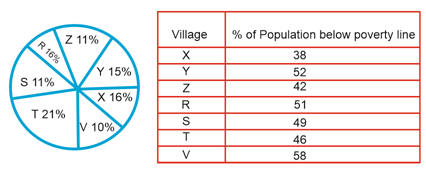
8 Q: Direction: The following pie chart shows proportion of the population of seven villages n 2009. Study the pie chart and answer question that follows:
The ratio of the below poverty line population of village ‘T’ to that of the below poverty line population of village ‘Z’ is
 1758 05d7f27b77f06bc6981e06df3
5d7f27b77f06bc6981e06df3- 111:23false
- 213:11false
- 323:11true
- 411:13false
- Show AnswerHide Answer
- Workspace
- SingleChoice
Answer : 3. "23:11"
Q:Directions: Study the following table carefully to answer the questions that follow .
Number of soldiers ( in thousands ) joining five different forces during six different.
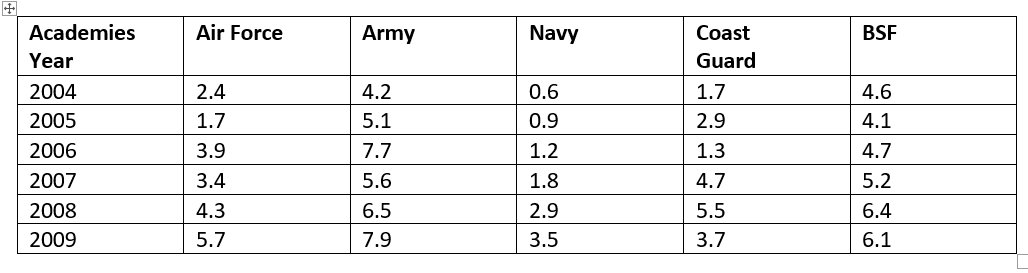
What was the ratio of the number of soldiers joining Army in the year 2008 to the number of soldiers joining Army in the year 2006?
1752 05e82e924fb2b5f39957b682e
5e82e924fb2b5f39957b682eNumber of soldiers ( in thousands ) joining five different forces during six different.
- 15:2false
- 23:7true
- 34:3false
- 45:1false
- 5None of thesefalse
- Show AnswerHide Answer
- Workspace
- SingleChoice
Answer : 2. "3:7 "
Q:Direction: Percentage of different types of employees in a company in two consecutive years.
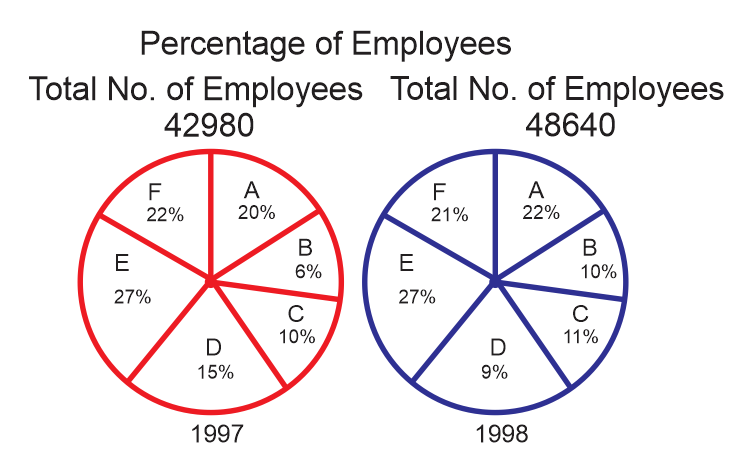
What was the approximate difference in the number of B type of employees during 1997 and 1998?
1744 05e3275f928cc9f701276fa95
5e3275f928cc9f701276fa95- 12620false
- 22085false
- 32285true
- 42325false
- Show AnswerHide Answer
- Workspace
- SingleChoice
Answer : 3. "2285"
Q:Direction: Study the pie chart carefully and answer the given questions. The pie chart shows the percentage breakup of students in different classes from VI to X in the year 2017
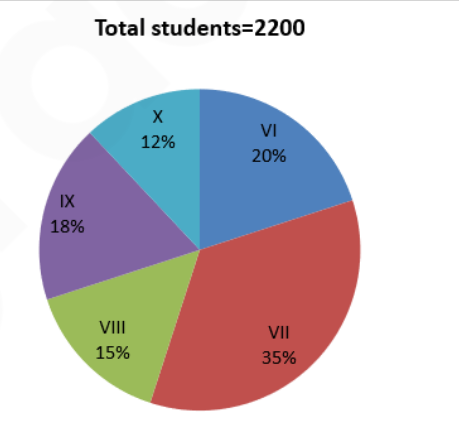
If in class VI, the ratio of boys to girls is 6:5 and the total number of girls in class VI is 50 less than that of the total number of girls in class VII. Find the ratio of the total number of boys in class VI to class VII.
1743 060a25701de4c2e1331dbe874
60a25701de4c2e1331dbe874- 16:13true
- 24:5false
- 35:7false
- 47:11false
- 59:13false
- Show AnswerHide Answer
- Workspace
- SingleChoice
Answer : 1. "6:13"
Q:The table given below shows the information about bats manufactured by 6 different companies. Each company manufactures only plastic and wooden bats. Each company labels these bats as Brand A or Brand B. The table shows the number of plastic bats as a percentage of total bats manufactured by each company. It also shows the ratio of wooden bats labelled A and B. Each company manufactured a total 550000 bats.

X= Average of plastic bats manufactured by V, U and T.
Y=Wooden bats of Brand A manufactured by V.
What is the value X – Y?
1738 05f30d8dfbcbb69394d1ca4d8
5f30d8dfbcbb69394d1ca4d8Y=Wooden bats of Brand A manufactured by V.
What is the value X – Y?
- 1197600false
- 2432890false
- 3260000true
- 4293300false
- Show AnswerHide Answer
- Workspace
- SingleChoice
Answer : 3. "260000"
Q:Study the following bar chart and answer the questions carefully.
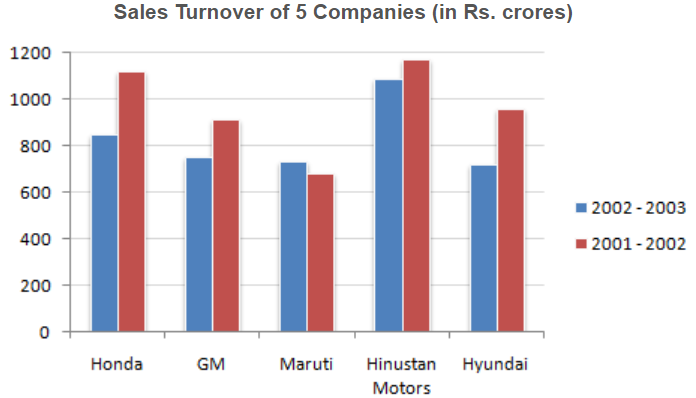
What is the approximate difference between the average sales turnover of all the companies put together between the years 2001 - 2002 and 2002 - 2003 ?
1737 05fd34333531d336d4b4e9e07
5fd34333531d336d4b4e9e07- 1133.45false
- 2142.48true
- 3117.6false
- 4115.25false
- 5None of thesefalse
- Show AnswerHide Answer
- Workspace
- SingleChoice
Answer : 2. "142.48"
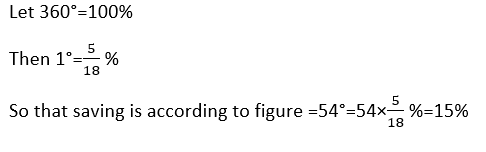
Q:The following pie-chart shows the monthly expenditure of family on various items. If the family spends Rs. 825 on clothing answer the question
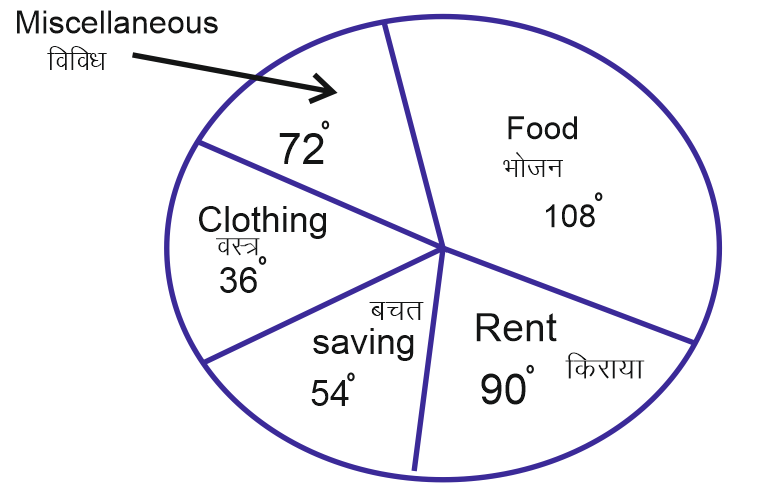
What percent of the total income does the family save
1724 05de4e15d76066724df64c321
5de4e15d76066724df64c321- 115 %true
- 250%false
- 320%false
- 425%false
- Show AnswerHide Answer
- Workspace
- SingleChoice
Answer : 1. "15 %"
Explanation :
Q:Directions-Study the following diagram and answer the four questions.
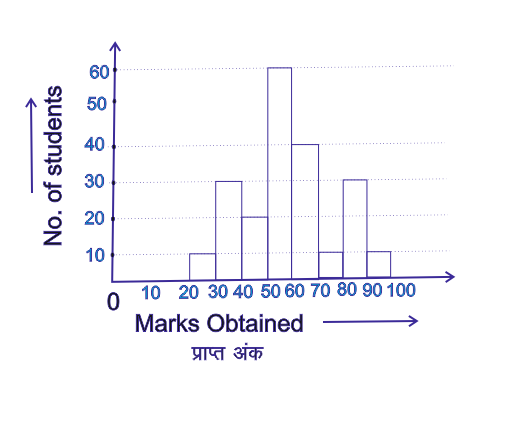
The range of marks obtained by maximum no. of students is
1723 05daea692cca75847f4d92d20
5daea692cca75847f4d92d20- 130-40false
- 260-70false
- 350-60true
- 480-90false
- Show AnswerHide Answer
- Workspace
- SingleChoice