Data Interpretation Questions Practice Question and Answer
8 Q:The pie graph given here shows the break-up of the cost of construction of a house.
Assuming that the total cost of construction is ₹ 6,00,000, answer the questions.
Break-up of the cost of construction of a house
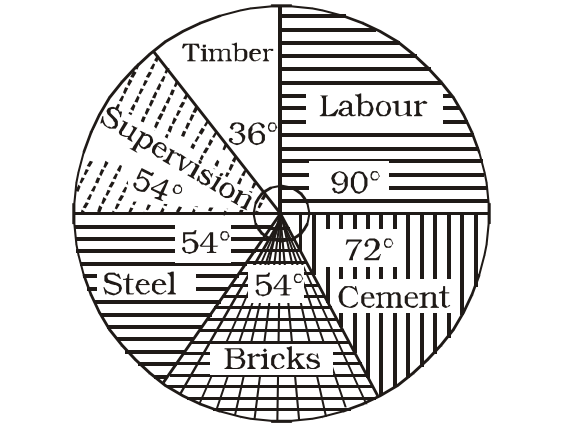
The amount spent on labour exceeds the amount spent on supervision by
1074 06332dfff31300b7ce4904f7c
6332dfff31300b7ce4904f7c- 1₹ 2,00,000false
- 2₹ 1,60,000false
- 3₹ 1,20,000false
- 4₹ 60,000true
- Show AnswerHide Answer
- Workspace
- SingleChoice
Answer : 4. "₹ 60,000"
Q:The pie graph given here shows the break-up of the cost of construction of a house.
Assuming that the total cost of construction is ₹ 6,00,000, answer the questions.
Break-up of the cost of construction of a house
The amount spent on cement, steel and supervision is what percent of the total cost of construction?
1081 06332dfac5c208a6bf707bc10
6332dfac5c208a6bf707bc10- 140%false
- 245%false
- 350%true
- 455%false
- Show AnswerHide Answer
- Workspace
- SingleChoice
Answer : 3. "50% "
Q:The pie graph given here shows the break-up of the cost of construction of a house.
Assuming that the total cost of construction is ₹ 6,00,000, answer the questions.
Break-up of the cost of construction of a house
The amount spent on cement is
1090 06332ddf25c208a6bf707b81a
6332ddf25c208a6bf707b81a- 1₹ 2,00,000false
- 2₹ 1,60,000false
- 3₹ 1,20,000true
- 4₹ 1,00,000false
- Show AnswerHide Answer
- Workspace
- SingleChoice
Answer : 3. "₹ 1,20,000 "
Q:The pie graph given here shows the break-up of the cost of construction of a house.
Assuming that the total cost of construction is ₹ 6,00,000, answer the questions.
Break-up of the cost of construction of a house
The amount spent on labour exceeds the amount spent on steel by
1151 06331968a31300b7ce48a8eba
6331968a31300b7ce48a8eba- 15 per cent of the total cost.false
- 210 per cent of the total cost.true
- 312 per cent of the total cost.false
- 415 per cent of the total cost.false
- Show AnswerHide Answer
- Workspace
- SingleChoice
Answer : 2. "10 per cent of the total cost. "
Q:Directions: The table given here shows the production of five types of cars by a company in the year 1989 to 1994. Study the table and answer questions.
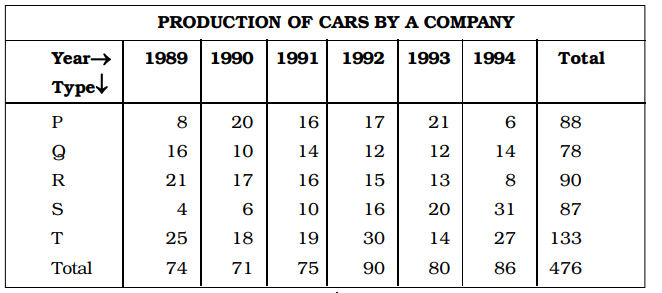
The percent increased in total production of all types of cars in1992 to that in 1991 was :
995 0632db3615c208a6bf7f2677e
632db3615c208a6bf7f2677e- 115%false
- 220%true
- 325%false
- 430%false
- Show AnswerHide Answer
- Workspace
- SingleChoice
Answer : 2. "20%"
Q:Directions: The table given here shows the production of five types of cars by a company in the year 1989 to 1994. Study the table and answer questions.
The production of which type of car was 25% of the total production of all types of cars during 1993?
1007 0632db32a751e5310a5d0fc30
632db32a751e5310a5d0fc30- 1Strue
- 2Rfalse
- 3Qfalse
- 4Pfalse
- Show AnswerHide Answer
- Workspace
- SingleChoice
Answer : 1. "S "
Q:Directions: The table given here shows the production of five types of cars by a company in the year 1989 to 1994. Study the table and answer questions.
During the period 1989-94, in which type of cars was a continuous increase in production?
1023 0632db292751e5310a5d0fb16
632db292751e5310a5d0fb16- 1Pfalse
- 2Qfalse
- 3Rfalse
- 4Strue
- Show AnswerHide Answer
- Workspace
- SingleChoice
Answer : 4. "S"
Q:Directions: The table given here shows the production of five types of cars by a company in the year 1989 to 1994. Study the table and answer questions.
In which year the total production of cars of types P and Q together was equal to the total production of cars of types R and S together?
1010 0632db25031300b7ce47a86f9
632db25031300b7ce47a86f9- 11990false
- 21991false
- 31994false
- 4None of the abovetrue
- Show AnswerHide Answer
- Workspace
- SingleChoice