Data Interpretation Questions Practice Question and Answer
8 Q:Direction: Study the following table carefully and answer the given questions. Table shows the of passed students in four schools and ratio between passed boys and girls among them. The ratio between failed boys and girls is reverse of passed ratio between them.
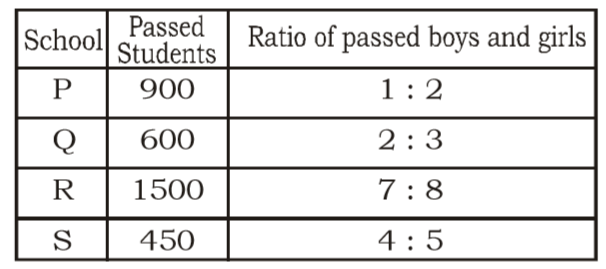
The number passed of girls from School S is approximately what percentage of passed girls from School Q?
1258 05e9d327f772f97276f50f67d
5e9d327f772f97276f50f67d
- 165 %false
- 272 %false
- 375 %false
- 469 %true
- 5None of thesefalse
- Show AnswerHide Answer
- Workspace
- SingleChoice
Answer : 4. "69 % "
Q:Directions: Read the following table and answer the questions below it:
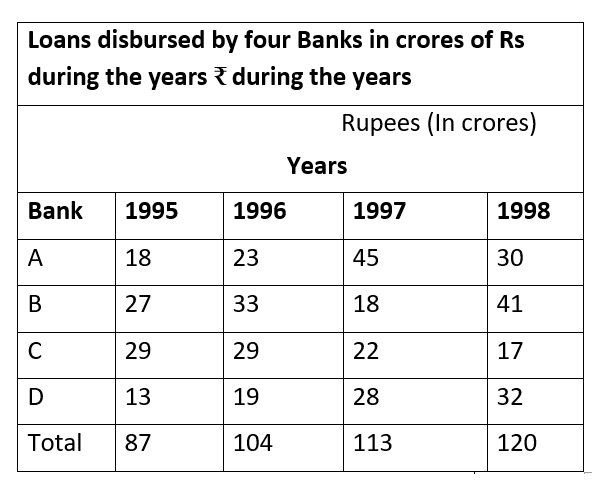
In which of the following banks, there was a continued increase in loan disbursement throughout the years?
1256 05e4e4f63701cfd31ff68f135
5e4e4f63701cfd31ff68f135
- 1Afalse
- 2Bfalse
- 3Cfalse
- 4Dtrue
- Show AnswerHide Answer
- Workspace
- SingleChoice
Answer : 4. "D "
Q: The following pie chart gives the measures of the central angles of the sectors that reflect the number of beds in each of 7 different hospitals with respect to the total number of beds in these 7 hospitals taken together.
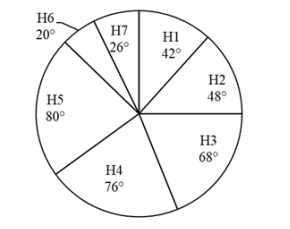
If the number of beds in H7 are 39, then what is the total number of beds in all the 7 hospitals taken together?
1253 0642251abdcb650c1456482a5
642251abdcb650c1456482a5
- 1720false
- 2540true
- 3450false
- 4630false
- Show AnswerHide Answer
- Workspace
- SingleChoice
Answer : 2. "540"
Q:Direction: Study the following table carefully to answer these questions.
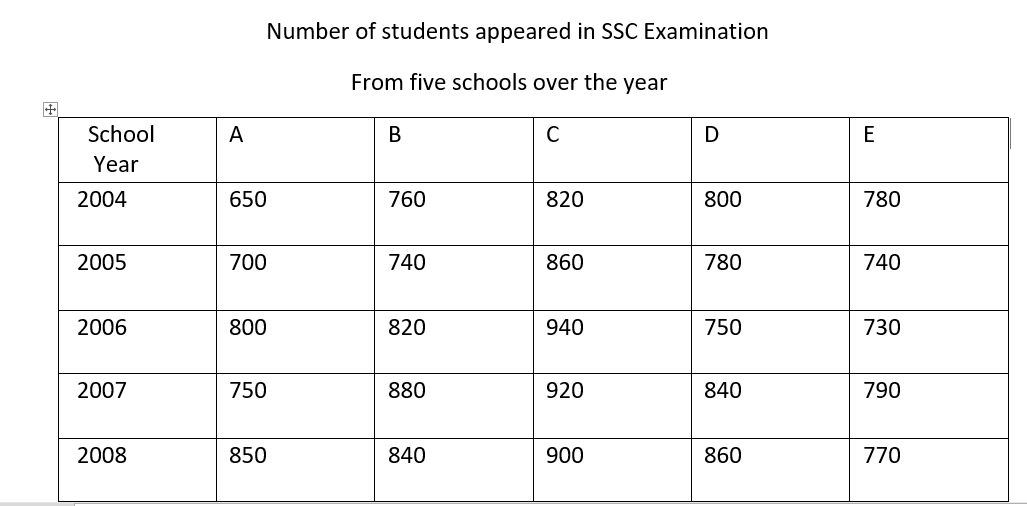
Number of students appeared in 2006 from school A is what per cent of the total number of students appeared from school A for all the years together ?
1253 05e6c689b0b8b1e6afc2ad1a0
5e6c689b0b8b1e6afc2ad1a0
- 1$$ 223{2 \over3}$$false
- 2$$ 22{1 \over3}$$false
- 3$$ 22{2 \over3}$$false
- 4$$ 21{1 \over3}$$true
- 5None of thesefalse
- Show AnswerHide Answer
- Workspace
- SingleChoice
Answer : 4. "$$ 21{1 \over3}$$"
Q:Pie chart shows the percent of money spent by family on various item during 1999. Study the graph and answer these questions.
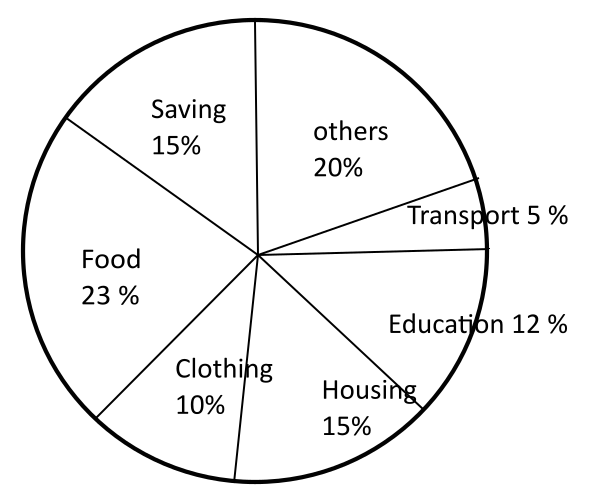
Graph shows that the maximum amount was spent on
1251 05fb4e5bfbf36696eb82682fb
5fb4e5bfbf36696eb82682fb
- 1Foodtrue
- 2Clothingfalse
- 3Housingfalse
- 4Othersfalse
- Show AnswerHide Answer
- Workspace
- SingleChoice
Answer : 1. "Food"
Q:Direction: The given Bar Graph Presents the number of different types of vehicles (in lakhs) exported by a company during 2014 and 2015.
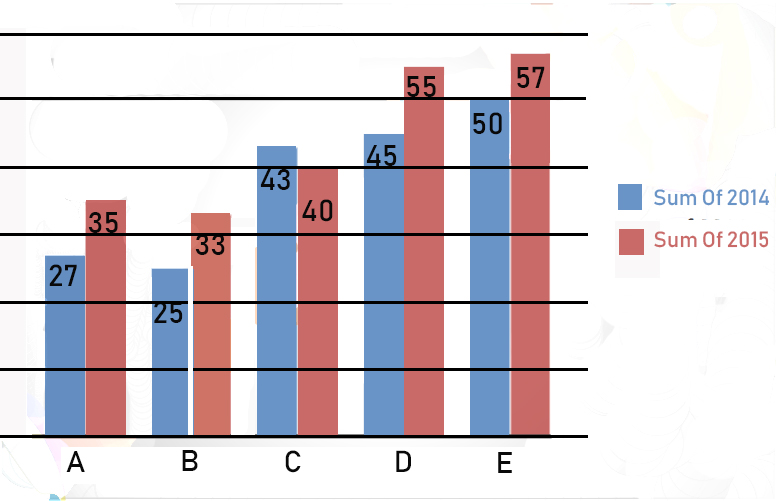
The average number type A, B and D vehicles exported in 2015 was x% less than the number of type E vehicles exported in 2014. What is the value of x?
1251 0602514ac083f2c6596c29b5d
602514ac083f2c6596c29b5d
- 120false
- 225false
- 318true
- 424false
- Show AnswerHide Answer
- Workspace
- SingleChoice
Answer : 3. "18"
Q:Direction: The following table shows the number of students of 7 colleges A, B, C, D, E, F, G participating in extra-curricular activities :
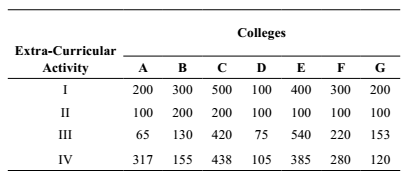
The median of data pertaining to activity III is
1249 0601146ecaf82aa3010a2f5cd
601146ecaf82aa3010a2f5cd
- 1540false
- 2229false
- 3153true
- 475false
- Show AnswerHide Answer
- Workspace
- SingleChoice
Answer : 3. "153"
Q:A bar graph showing the height of six mountain peaks. Study the bar graph and answer the following Questions.
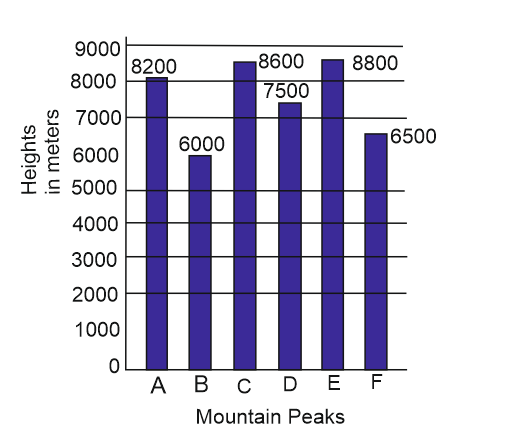
What is the ratio of the heights of the highest peak and the lowest peak?
1249 05f06dfa93f7f07047795f91a
5f06dfa93f7f07047795f91a
- 115 : 22false
- 222 : 15true
- 320 : 13false
- 420 : 13false
- Show AnswerHide Answer
- Workspace
- SingleChoice

