Data Interpretation Questions Practice Question and Answer
8 Q:Directions: Answer the questions based on the information given below:
The following line graph shows revenue and expenditure of company A for 5 years (in Lakhs):
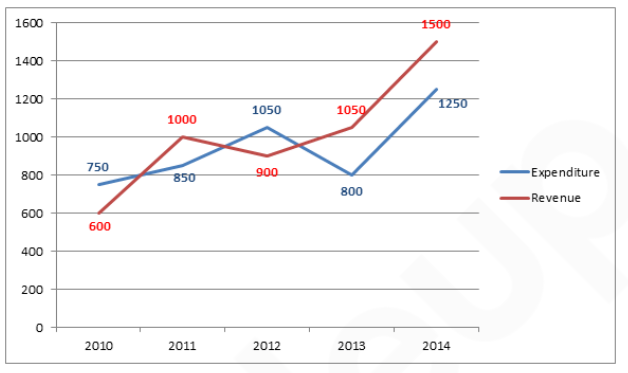
What is the difference between revenue and expenditure of company A over the year?
1367 060a4de80b33a50608a41d237
60a4de80b33a50608a41d237The following line graph shows revenue and expenditure of company A for 5 years (in Lakhs):
- 1200 lakhsfalse
- 2300 lakhsfalse
- 3350 lakhstrue
- 4250 lakhsfalse
- 5None of thesefalse
- Show AnswerHide Answer
- Workspace
- SingleChoice
Answer : 3. "350 lakhs "
Q:Direction: Study the line graph carefully to answer the following questions.
Line graph shows the production (in thousand units) and percentage of exported mobiles, computers and laptops.
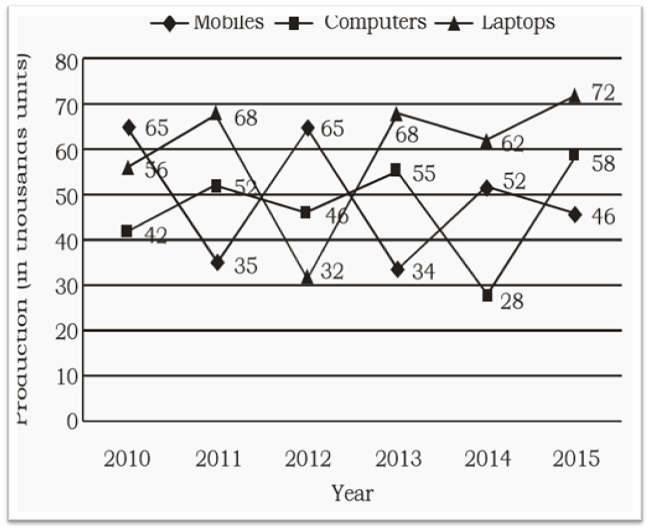
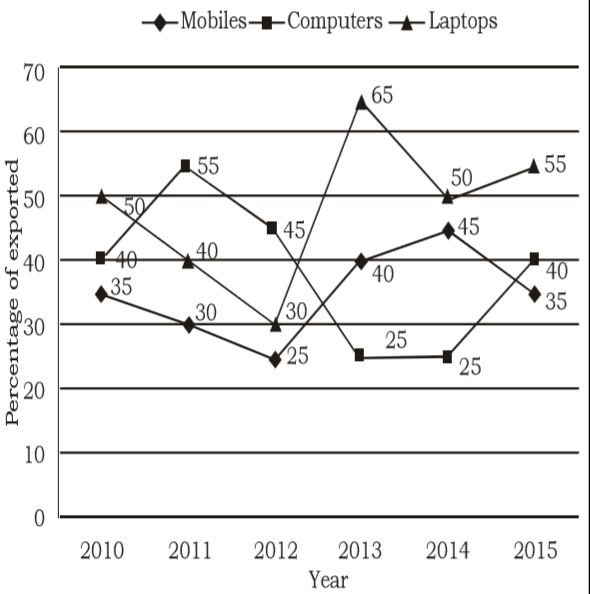
Find the total number of Mobiles, Computers and Laptops exported in the year 2011.
1362 05e9d1daedc1ff94610d1bfd6
5e9d1daedc1ff94610d1bfd6Line graph shows the production (in thousand units) and percentage of exported mobiles, computers and laptops.
- 164,350false
- 265,300false
- 366,300true
- 468,300false
- 5None of thesefalse
- Show AnswerHide Answer
- Workspace
- SingleChoice
Answer : 3. "66,300 "
Q:The following table shows the number of units of product produced and sold by a company over the course of six years.
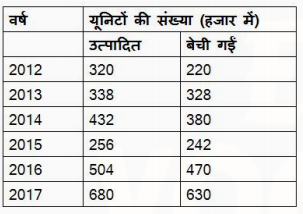
The number of units of product sold in 2016 is approximately what percent more than the average number of units produced from 2012 to 2016?
1361 0602e06b16d461f6639872fc4
602e06b16d461f6639872fc4- 124false
- 232false
- 321false
- 427true
- Show AnswerHide Answer
- Workspace
- SingleChoice
Answer : 4. "27"
Q:Direction: Study the following table carefully to answer these questions.
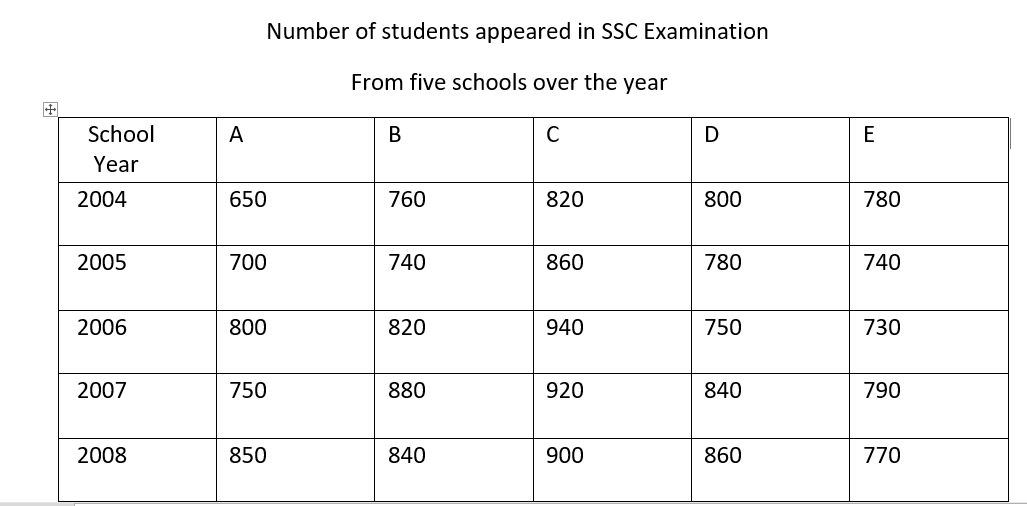
What is the average number of students appeared from school B for all the years ?
1361 05e6c67550b8b1e6afc2acb83
5e6c67550b8b1e6afc2acb83- 1828false
- 2815false
- 3823false
- 4808true
- 5855false
- Show AnswerHide Answer
- Workspace
- SingleChoice
Answer : 4. "808"
Q:The given pie chart shows the percentage of students enrolled for the courses A, B, C, D and E in a university and the table shows the percentage of students that passed, out of the enrolled students.
Total Students=60,000
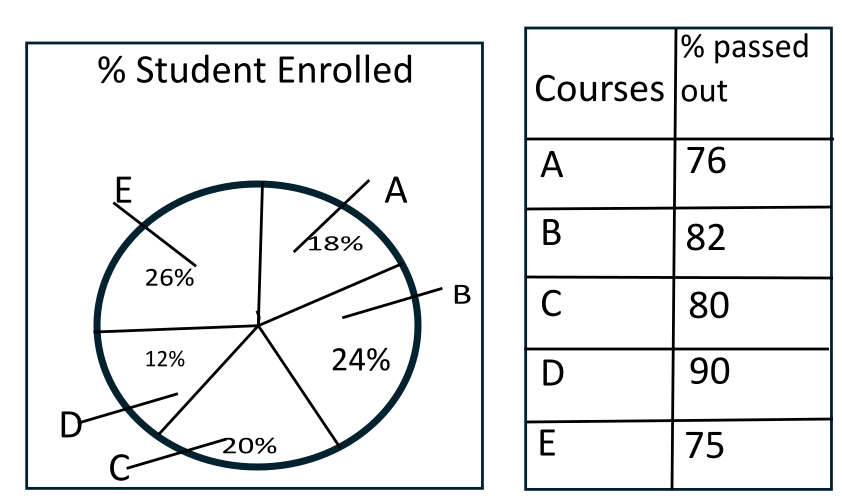
How many students passed in Course C?
1360 05ffc357323210f22f33037a7
5ffc357323210f22f33037a7Total Students=60,000
- 18800false
- 29600true
- 37300false
- 46800false
- Show AnswerHide Answer
- Workspace
- SingleChoice
Answer : 2. "9600"
Q:Direction: Study the following table carefully and answer the given questions. Table shows the of passed students in four schools and ratio between passed boys and girls among them. The ratio between failed boys and girls is reverse of passed ratio between them.
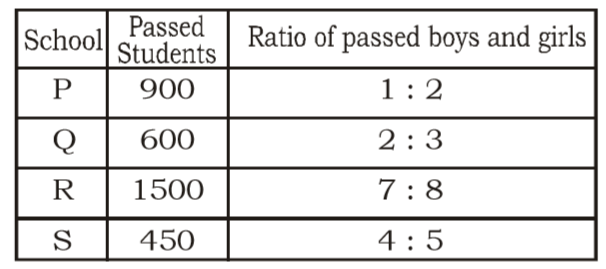
If the difference between the failed boys and girls is 25 in school S, then find the ratio between passed and failed students in School S?
1359 05e9d33f50a165a45b758607c
5e9d33f50a165a45b758607c- 13 : 1false
- 24 : 1false
- 32 : 1true
- 41 : 2false
- 51 : 3false
- Show AnswerHide Answer
- Workspace
- SingleChoice
Answer : 3. "2 : 1 "
Q:Directions :- Refer the graph and answer the given questions.
The following line graph shows the number of products sold by company A and B during six years.
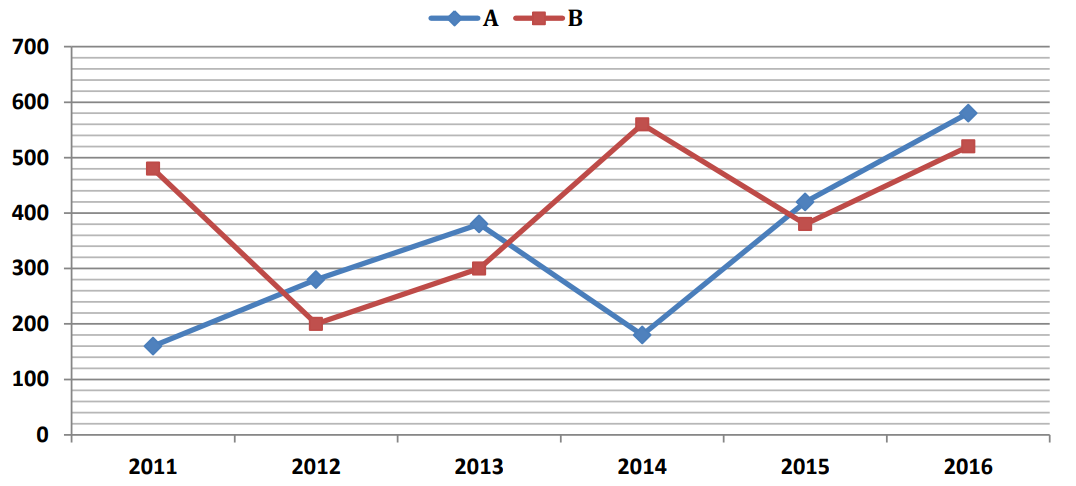
The number of products sold by A in 2014 is what per cent of the number of products sold by B in 2013?
1359 05fd32ec9c46a213fc5c470f1
5fd32ec9c46a213fc5c470f1The following line graph shows the number of products sold by company A and B during six years.
- 160%true
- 250%false
- 348%false
- 456%false
- 5None of thesefalse
- Show AnswerHide Answer
- Workspace
- SingleChoice
Answer : 1. "60%"
Q:Directions: The line graph shows the number of work visas issued by a country in each year from 2011 to 2016. Study the diagram and answer the following questions .
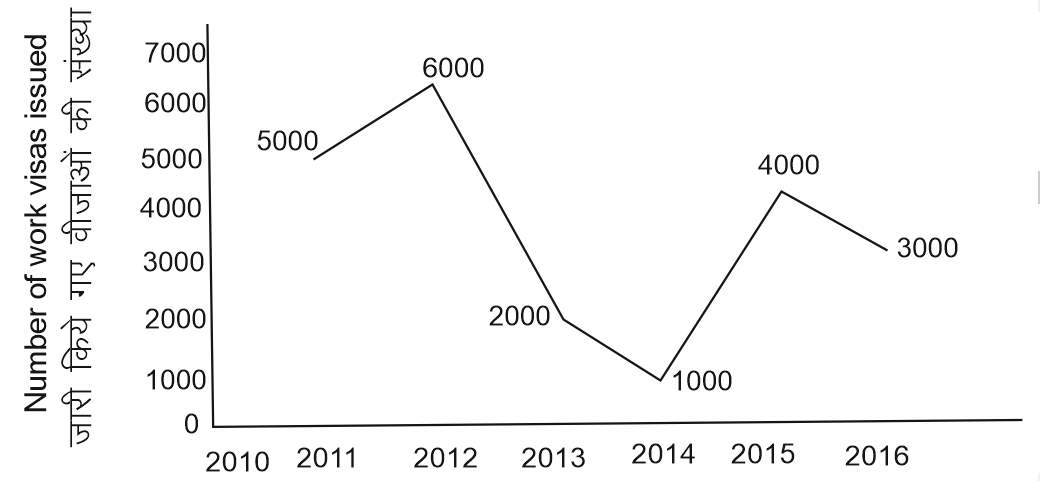
Number of work visas issued in 2016 were lower than the previous year by ?
1356 05ed9f0edf528050f915051e7
5ed9f0edf528050f915051e7- 120 %false
- 2100 %false
- 350 %false
- 425 %true
- Show AnswerHide Answer
- Workspace
- SingleChoice