Join Examsbook
What is the average of the total vacancies?
5The line graph shows the number of vacancies of accountants in a certain company. Study the diagram and answer the following questions.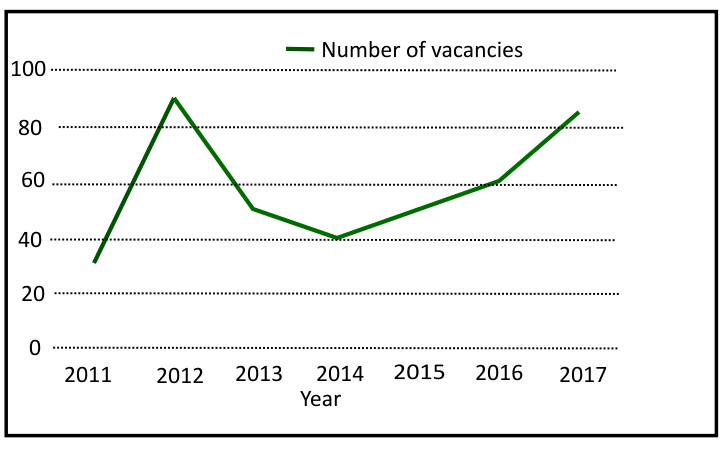
Q:
What is the average of the total vacancies?
- 158.58false
- 258.57true
- 360false
- 455false
- Show AnswerHide Answer
- Workspace