Data Interpretation Questions Practice Question and Answer
8 Q:Directions: Study the bar-graph given below & answer the questions.
Pie-chart given below shows the percentage distribution of total no. of boys in six different Schools.
Total Boys in all schools together = 6400
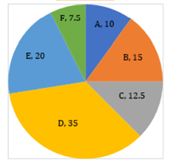
What is the average of total no. of boys in school A, C and F?
1292 05e93de443d193e3bf6fdbdff
5e93de443d193e3bf6fdbdffPie-chart given below shows the percentage distribution of total no. of boys in six different Schools.
Total Boys in all schools together = 6400
- 1640true
- 2680false
- 3720false
- 4None of thesefalse
- 5540false
- Show AnswerHide Answer
- Workspace
- SingleChoice
Answer : 1. "640"
Q:Study the given pie chart and answer the question that follows.
Distribution (Degree wise) of students studying in schools A, B, C, D and E
Total Number of students =9000
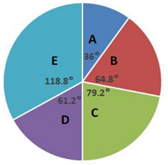
The total number of students in schools D and E is what percentage more than the total number of students in school B and C?
1292 060532d02a37d522d6c19d671
60532d02a37d522d6c19d671Distribution (Degree wise) of students studying in schools A, B, C, D and E
Total Number of students =9000
- 125true
- 220false
- 330false
- 435false
- Show AnswerHide Answer
- Workspace
- SingleChoice
Answer : 1. "25"
Q:The given table represents the number of engineers recruited by four companies A, B, C and D over the years. Study the table carefully and answer the question that follow.
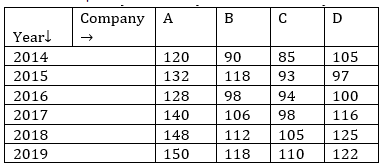
The total number of engineers recruited by company A in 2014 to 2017 is what percentage more than the total number of engineers recruited by all four companies in 2019?
1289 060927140bef26c5d152b8bfe
60927140bef26c5d152b8bfe- 13.5false
- 22.5false
- 33false
- 44true
- Show AnswerHide Answer
- Workspace
- SingleChoice
Answer : 4. "4"
Q:Direction: Study the following graph carefully and answer the following questions.
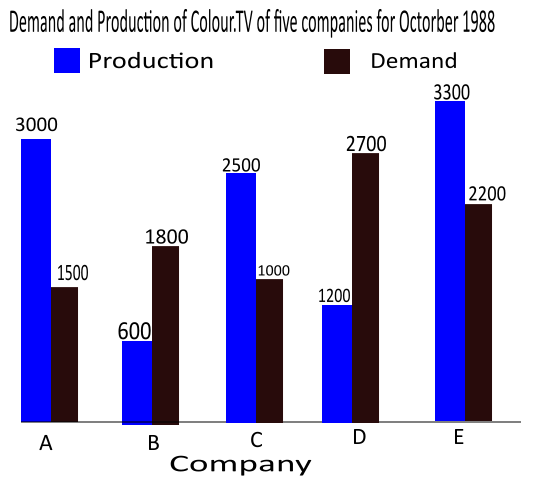
What is the ratio of companies having more demand than production to those having more production than demand?
1286 060069c2744bc07148778f544
60069c2744bc07148778f544- 14 :1false
- 23 : 2false
- 32 : 3true
- 42 : 2false
- Show AnswerHide Answer
- Workspace
- SingleChoice
Answer : 3. "2 : 3"
Q:Directions: Answer the questions based on the information given below:
The following line graph shows revenue and expenditure of company A for 5 years (in Lakhs):
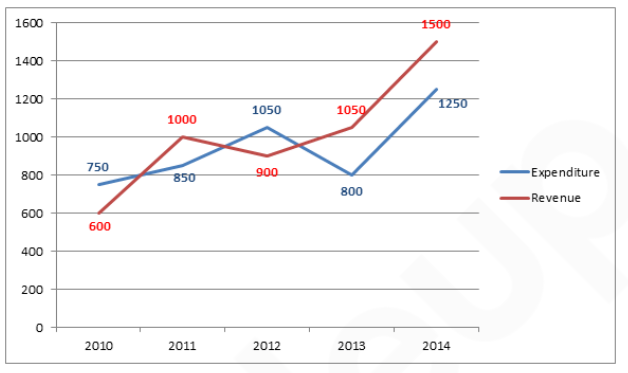
In which year was the profit percentage highest?
Given that: Profit = $$\left({Revenue-Expenditure\over Expenditure } \right)\ $$
1286 060a4e0bef98a5977251a0069
60a4e0bef98a5977251a0069The following line graph shows revenue and expenditure of company A for 5 years (in Lakhs):
Given that: Profit = $$\left({Revenue-Expenditure\over Expenditure } \right)\ $$
- 12014false
- 22010false
- 32011false
- 42012false
- 52013true
- Show AnswerHide Answer
- Workspace
- SingleChoice
Answer : 5. "2013"
Q:Direction: The following table shows the number of students of 7 colleges A, B, C, D, E, F, G participating in extra-curricular activities :
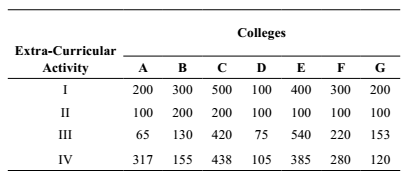
Percentage of the number of students in activity II to that of IV is ?
1281 0601147efaf82aa3010a2f6fc
601147efaf82aa3010a2f6fc- 137false
- 242false
- 348false
- 450true
- Show AnswerHide Answer
- Workspace
- SingleChoice
Answer : 4. "50"
Q:Table below shows the number of candidates appearing for the interview and the percentage of candidates found eligible for the post in various companies (A, B, C, D, E, F).
Study the Tables and give answer the following Questions.
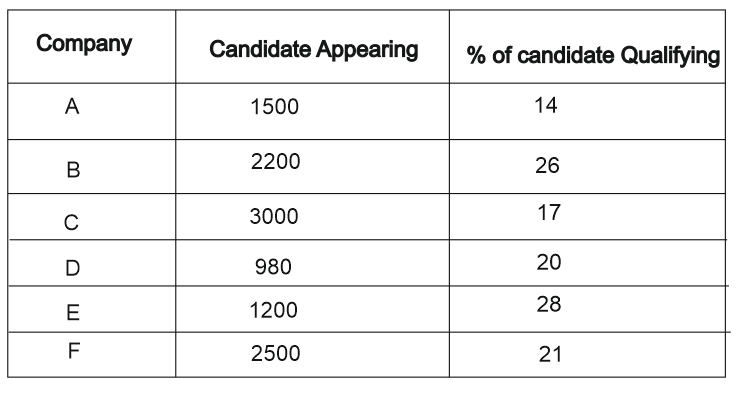
How many qualified candidates are there in Company D?
1279 05f1e72cb3b87486bfc539040
5f1e72cb3b87486bfc539040Study the Tables and give answer the following Questions.
- 1109false
- 2190false
- 3198false
- 4196true
- Show AnswerHide Answer
- Workspace
- SingleChoice
Answer : 4. "196"
Q:Directions : The graph shows the demand and production of different companies. Study the graph and answer the following questions.
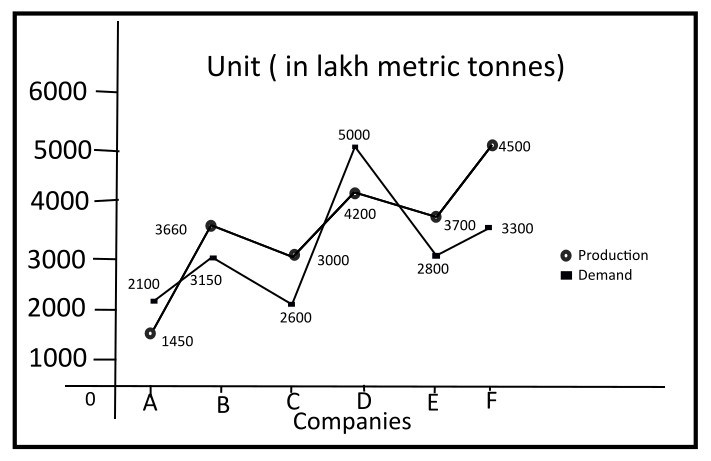
What is the lowest production company?
1278 05f4f73630c72eb2349337ad6
5f4f73630c72eb2349337ad6- 1Cfalse
- 2Dfalse
- 3Ffalse
- 4Atrue
- Show AnswerHide Answer
- Workspace
- SingleChoice