Data Interpretation Questions Practice Question and Answer
8 Q:A bar graph showing the height of six mountain peaks. Study the bar graph and answer the following Questions.
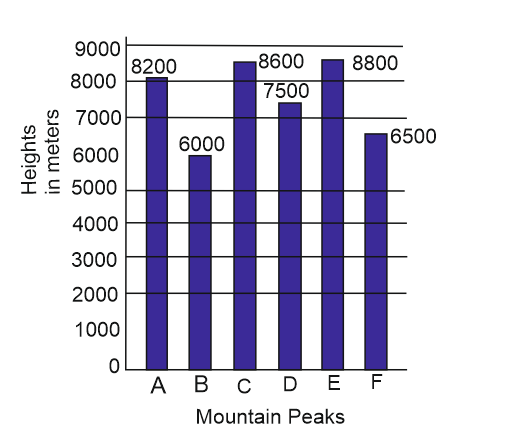
What is the ratio of the heights of the highest peak and the lowest peak?
1607 05f06dfa93f7f07047795f91a
5f06dfa93f7f07047795f91a- 115 : 22false
- 222 : 15true
- 320 : 13false
- 420 : 13false
- Show AnswerHide Answer
- Workspace
- SingleChoice
Answer : 2. "22 : 15"
Q:A bar graph showing the height of six mountain peaks. Study the bar graph and answer the following Questions.
Which peak is the second highest?
1708 05f06df4d3f7f07047795f8f5
5f06df4d3f7f07047795f8f5- 1Efalse
- 2Afalse
- 3Bfalse
- 4Ctrue
- Show AnswerHide Answer
- Workspace
- SingleChoice
Answer : 4. "C"
Q:A bar graph showing the height of six mountain peaks. Study the bar graph and answer the following Questions.
The average height of all the peak (in meters) is
2163 05f06deffb13c2d244adaaeee
5f06deffb13c2d244adaaeee- 17600true
- 27601.5false
- 37599.5false
- 47610false
- Show AnswerHide Answer
- Workspace
- SingleChoice
Answer : 1. "7600"
Q:The pie chart given below shows the number of shoes of 5 different brands in a multi brand store. There are total 1200 shoes.
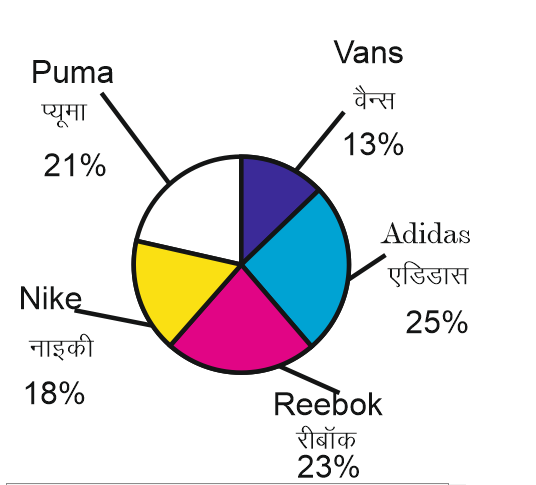
Puma shoes are how much percent more than the Nike Shoes?
1782 05efeb4917228dd6b06e755f0
5efeb4917228dd6b06e755f0- 114.28false
- 216.66true
- 325false
- 421.33false
- Show AnswerHide Answer
- Workspace
- SingleChoice
Answer : 2. "16.66"
Q:The pie chart given below shows the number of shoes of 5 different brands in a multi brand store. There are total 1200 shoes.
What is the difference in number of shoes of Puma and Vans?
1691 05efeb436eb90be58c5960fed
5efeb436eb90be58c5960fed- 196true
- 2156false
- 3187false
- 4112false
- Show AnswerHide Answer
- Workspace
- SingleChoice
Answer : 1. "96"
Q:The pie chart given below shows the number of shoes of 5 different brands in a multi brand store. There are total 1200 shoes.
How many shoes are there of Reebok brand?
1628 05efeb3dd7228dd6b06e75566
5efeb3dd7228dd6b06e75566- 1230false
- 2276true
- 3286false
- 4216false
- Show AnswerHide Answer
- Workspace
- SingleChoice
Answer : 2. "276"
Q:Study the table and answer the questions and give answer the following questions.
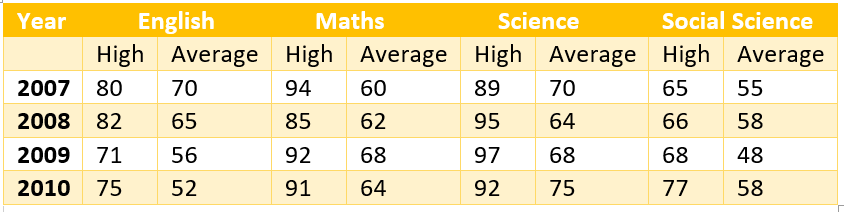
In which year , the difference between the highest and the average marks in maths was maximum?
2118 05eec8745985769334140bd68
5eec8745985769334140bd68- 12007false
- 22009false
- 32008true
- 42010false
- Show AnswerHide Answer
- Workspace
- SingleChoice
Answer : 3. "2008"
Q:Study the table and answer the questions and give answer the following questions.
Supposing that there were 40 students in sciences in the year 2009. How much total of marks did they receive combined together?
2065 05eec85e6eee45c3b837fa9ef
5eec85e6eee45c3b837fa9ef- 12800false
- 22720true
- 32560false
- 43000false
- Show AnswerHide Answer
- Workspace
- SingleChoice