Data Interpretation Questions Practice Question and Answer
8 Q:The following pie chart gives the central angles of the sectors representing the number of cameras sold form a shop from July to November in a certain Year.
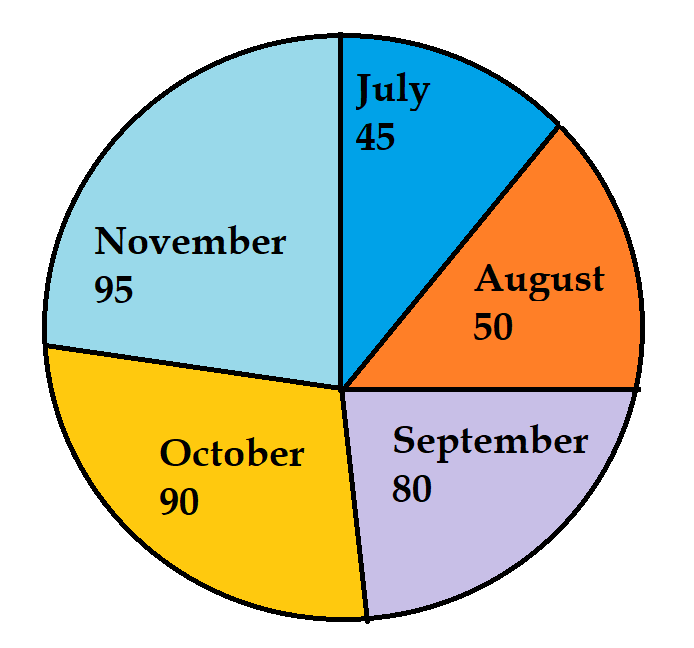
what percentage are the sales in July of the total sales from July to November
1249 06421582f32185cce3704c59f
6421582f32185cce3704c59f- 125%false
- 250%false
- 312.5%true
- 420%false
- Show AnswerHide Answer
- Workspace
- SingleChoice
Answer : 3. "12.5%"
Q:Directions: Read the below data carefully and answer the following questions.
The table shows the total number of ice cream (Chocobar + Cornetto) was given by Santa Claus on the day of Xmas to 5 children. It also shows the number of Chocobar ice-creams is how much more or less percentage of the total number of Cornetto ice-creams.
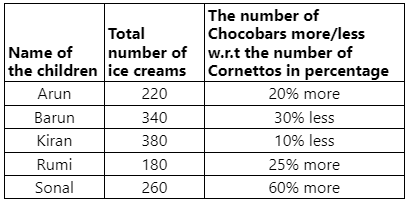
Find the difference between the total number of Cornettoes all of them have and the total number of Chocobars everyone has.
1249 064dccb6580ef1e74b4edcf82
64dccb6580ef1e74b4edcf82The table shows the total number of ice cream (Chocobar + Cornetto) was given by Santa Claus on the day of Xmas to 5 children. It also shows the number of Chocobar ice-creams is how much more or less percentage of the total number of Cornetto ice-creams.
- 115false
- 220true
- 330false
- 445false
- 5None of thesefalse
- Show AnswerHide Answer
- Workspace
- SingleChoice
Answer : 2. "20"
Q: The following bar graph shows the number of girls in a school over 5 years.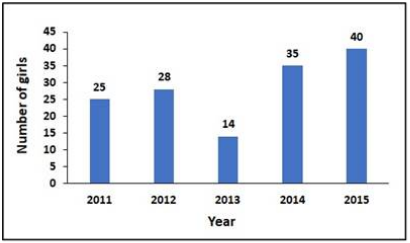
Find the percentage decrease in the number of girls from the year 2012 to the year 2013.
1249 0643d18a5a16c2dfa9cee3c86
643d18a5a16c2dfa9cee3c86- 150%true
- 240%false
- 320%false
- 430%false
- Show AnswerHide Answer
- Workspace
- SingleChoice
Answer : 1. "50%"
Q:The table given below shows the information about bats manufactured by 6 different companies. Each company manufactures only plastic and wooden bats. Each company labels these bats as Brand A or Brand B. The table shows the number of plastic bats as a percentage of total bats manufactured by each company. It also shows the ratio of wooden bats labelled A and B. Each company manufactured a total 550000 bats.

What is the total number of wooden bats of brand A manufactured by company T?
1249 05f30d291c006da57832960d6
5f30d291c006da57832960d6- 123,420false
- 222,990false
- 368,920false
- 472,600true
- Show AnswerHide Answer
- Workspace
- SingleChoice
Answer : 4. "72,600"
Q:Study the given graph and answer the question that follows.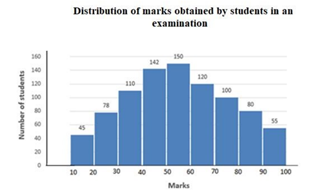
The total number of students obtaining less than 50 marks is what percentage more than the total number of students obtaining 60 marks or more ( correct to one decimal place).
1244 060532740a37d522d6c19c1cd
60532740a37d522d6c19c1cd- 16.8false
- 26.2false
- 34.4false
- 45.6true
- Show AnswerHide Answer
- Workspace
- SingleChoice
Answer : 4. "5.6"
Q:Direction: The following table shows the number of students of 7 colleges A, B, C, D, E, F, G participating in extra-curricular activities :
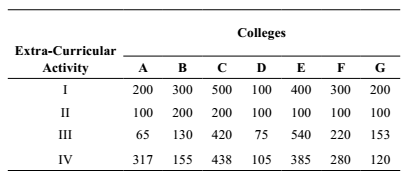
The ratio of total number of students in activity II and I is ?
1242 060114773af82aa3010a2f6c5
60114773af82aa3010a2f6c5- 11 : 2false
- 29 : 20true
- 319 : 7false
- 421 : 10false
- Show AnswerHide Answer
- Workspace
- SingleChoice
Answer : 2. "9 : 20 "
Q:Directions : The expenses of a country for a particular year is given in Pie–Chart. Read the Pie– Chart and answer the questions.
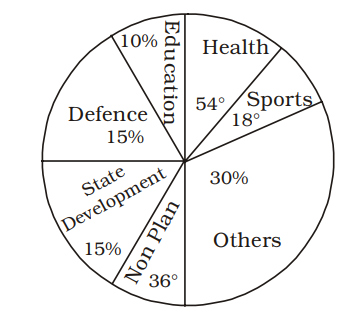
The percent of excess money spent on Others than that on Sports is
1241 063ac35174edf0d569930f9f0
63ac35174edf0d569930f9f0- 120%false
- 225%true
- 350%false
- 428%false
- Show AnswerHide Answer
- Workspace
- SingleChoice
Answer : 2. "25%"
Q:Directions: The Pie chart given here represents the domestic expenditure of a family in per cent. Study the chart and answer the following questions if the total monthly income of the family is ₹ 33,650.
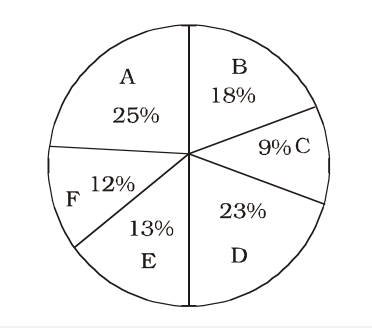
A: Expenditure on food
B: Expenditure on house-rent
C: Expenditure on entertainment
D: Expenditure on education and maintenance of children
E: Medical and miscellaneous expenditure
F: Deductions towards provident fund
Had there been no children in the family what would have been the total savings of the family including that provident fund?
1240 0638f31ecd319b37ca1826e64
638f31ecd319b37ca1826e64- 1₹ 12,667.50false
- 2₹ 12,625.50false
- 3₹ 11,727.50false
- 4₹ 11,777.50true
- Show AnswerHide Answer
- Workspace
- SingleChoice