Data Interpretation Questions Practice Question and Answer
8 Q:Study the table and answer the questions and give answer the following questions.
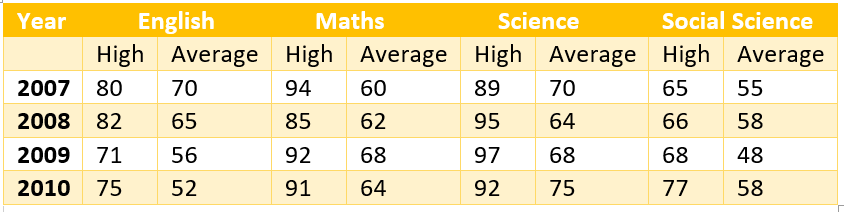
What is the overall average of marks in the four subjects in the year 2009?
2317 05eec856413d72d584fb845ff
5eec856413d72d584fb845ff- 163false
- 265false
- 364false
- 460true
- Show AnswerHide Answer
- Workspace
- SingleChoice
Answer : 4. "60"
Q:Directions: The following pie-chart represents the result of 600 successful students in various subject of an examination. Study the Pie-chart and answer question.
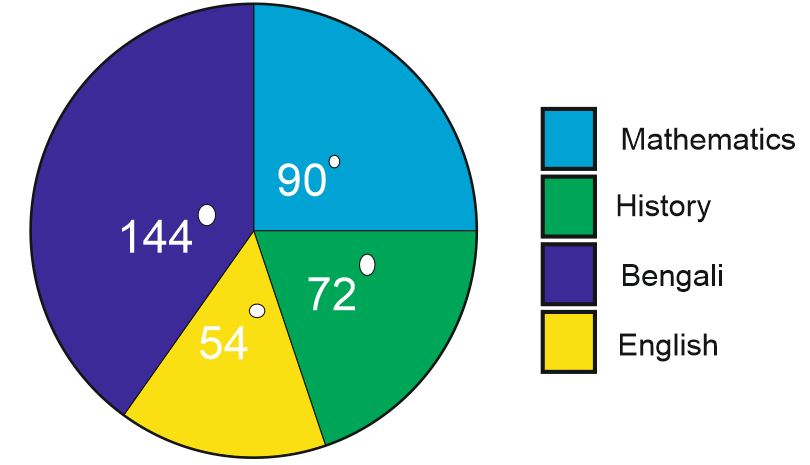
The number of students who passed in Bengali is –
2159 05ee30248e9ea010382e7e3d2
5ee30248e9ea010382e7e3d2- 1240true
- 2320false
- 3180false
- 4140false
- Show AnswerHide Answer
- Workspace
- SingleChoice
Answer : 1. "240"
Q:Directions: The following pie-chart represents the result of 600 successful students in various subject of an examination. Study the Pie-chart and answer question.
The number of students passed in English is less than the number of students passed in Mathematics by
1809 05ee301b7f72c0e153c805ae4
5ee301b7f72c0e153c805ae4- 150false
- 260true
- 390false
- 475false
- Show AnswerHide Answer
- Workspace
- SingleChoice
Answer : 2. "60"
Q:Directions: The following pie-chart represents the result of 600 successful students in various subject of an examination. Study the Pie-chart and answer question.
The percentage of students who passed in English is
2650 05ee3016e2bf4c40446491e93
5ee3016e2bf4c40446491e93- 115%true
- 220%false
- 35%false
- 412%false
- Show AnswerHide Answer
- Workspace
- SingleChoice
Answer : 1. "15%"
Q:Directions: The following pie-chart represents the result of 600 successful students in various subject of an examination. Study the Pie-chart and answer question.
The number of students passed in Bengali is greater than the number of students passed in History by
2295 05ee301082bf4c40446491ce6
5ee301082bf4c40446491ce6- 1150false
- 260false
- 3120true
- 4100false
- Show AnswerHide Answer
- Workspace
- SingleChoice
Answer : 3. "120"
Q:Directions: The following pie-chart represents the result of 600 successful students in various subject of an examination. Study the Pie-chart and answer question.
The ratio of students who passed in Bengali, to the students who passed in History is
2262 05ee30031f72c0e153c805a7a
5ee30031f72c0e153c805a7a- 11 : 2false
- 22 : 1true
- 33 : 4false
- 43 : 5false
- Show AnswerHide Answer
- Workspace
- SingleChoice
Answer : 2. "2 : 1"
Q:Directions: The line graph shows the number of work visas issued by a country in each year from 2011 to 2016. Study the diagram and answer the following questions .
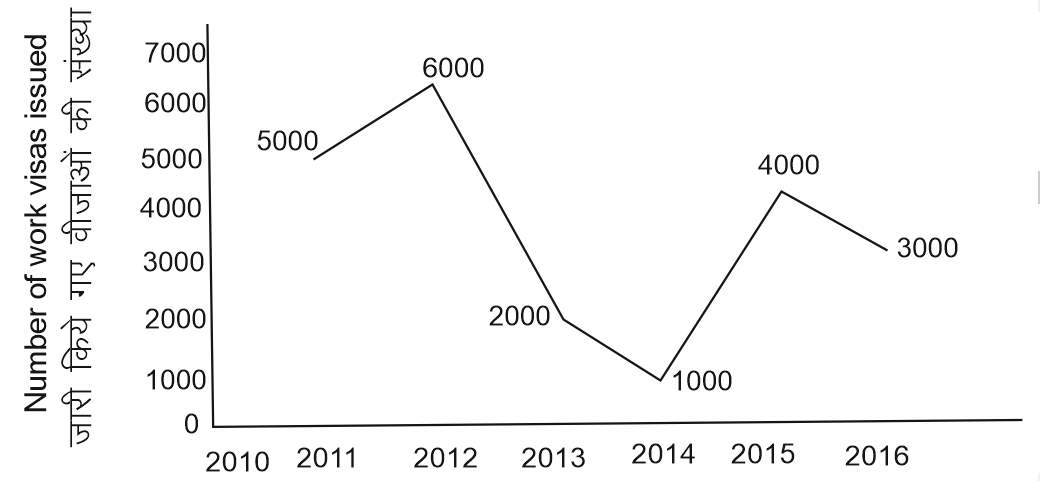
Number of work visas issued in 2016 were lower than the previous year by ?
1357 05ed9f0edf528050f915051e7
5ed9f0edf528050f915051e7- 120 %false
- 2100 %false
- 350 %false
- 425 %true
- Show AnswerHide Answer
- Workspace
- SingleChoice
Answer : 4. "25 %"
Q:Directions: The line graph shows the number of work visas issued by a country in each year from 2011 to 2016. Study the diagram and answer the following questions .
Number of work visas issued were more than those issued in the previous years in how many years ?
1311 05ed9f058e11a1c4b43e6e702
5ed9f058e11a1c4b43e6e702- 11false
- 23false
- 34false
- 42true
- Show AnswerHide Answer
- Workspace
- SingleChoice