Data Interpretation Questions Practice Question and Answer
8 Q:Direction: Study the given pie chart carefully and answer the following questions accordingly. Given pie chart shows the percentage of players taking part in six different games in an event.
Total number of Players = 1800
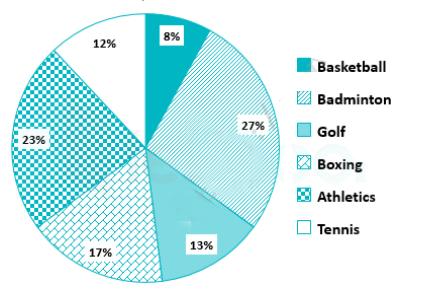
What is the total number of players taking part in Athletics, Badminton and Tennis?
1240 064e75f654a145f0934d9db6f
64e75f654a145f0934d9db6f- 11226false
- 21116true
- 31176false
- 4998false
- 5None of thesefalse
- Show AnswerHide Answer
- Workspace
- SingleChoice
Answer : 2. "1116"
Q:Study the given pie chart and answer the question that follows.
Break-up (degree-wise) of the number of students in five schools (A, B, C, D and E) in a city.
Total number of students =5200
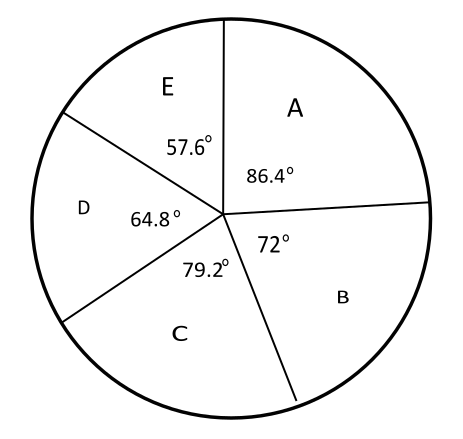
If the ratio of the number of boys to that of girls in school B is 7:6 and the ratio of number of boys to that of girls in school D is 4 : 5, then what is the ratio of number of boys in B to that of girls in D?
1240 05fbf75014d67184d07c60ab1
5fbf75014d67184d07c60ab1Break-up (degree-wise) of the number of students in five schools (A, B, C, D and E) in a city.
Total number of students =5200
- 112 : 13false
- 213 : 12false
- 314 : 13true
- 413 : 14false
- Show AnswerHide Answer
- Workspace
- SingleChoice
Answer : 3. "14 : 13"
Q:Direction: Study the following information to answer the questions.
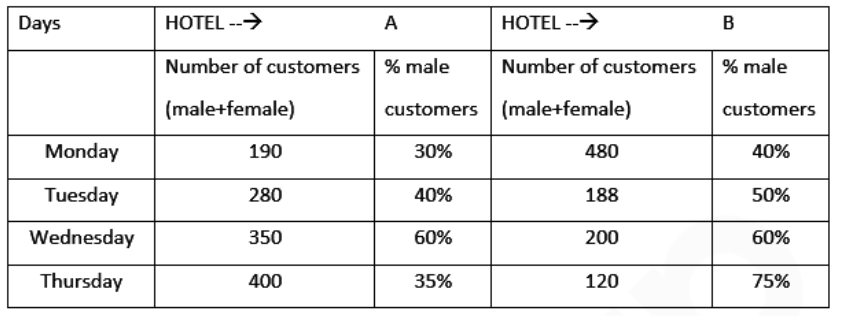
What is the average number of male customers in hotel B on Monday, Wednesday and Thursday?
1239 0609d1c318cf832661da7b514
609d1c318cf832661da7b514- 1175false
- 2184false
- 3134true
- 4188false
- 5185false
- Show AnswerHide Answer
- Workspace
- SingleChoice
Answer : 3. "134"
Q:Directions: Read the given pie and table carefully and answer the following questions.
The pie chart shows the percentage distribution of people who found COVID – 19 positive in four major cities of India from 1st July to 31st August 2020 and the table shows the number of people who tested positive in July from these cities.
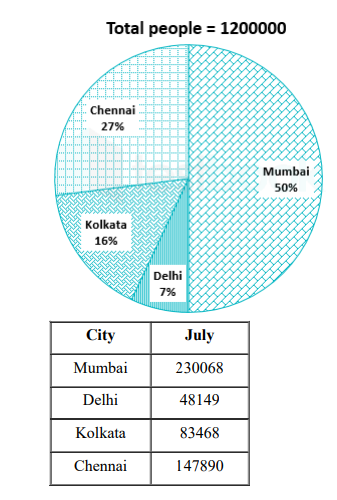
If the recovery rate is 70% and the death rate is 10% of total tested cases in Chennai at the end of July. How many active cases are on 1st August, if no case is found on that day?
1233 064f567f490902899fbf4746e
64f567f490902899fbf4746e- 132593false
- 221500false
- 315320false
- 429578true
- 5None of thesefalse
- Show AnswerHide Answer
- Workspace
- SingleChoice
Answer : 4. "29578"
Q:Directions : A bar graph showing the heights of six mountain peaks is given below. Study the bar graph and answer the questions.

When the heights of the given peaks are written in ascending order, what is the average of the middle two peaks?
1231 063930cfa9dda13791d7446ff
63930cfa9dda13791d7446ff- 17950 mfalse
- 27560 mfalse
- 37650 mfalse
- 47850 mtrue
- Show AnswerHide Answer
- Workspace
- SingleChoice
Answer : 4. "7850 m"
Q:Direction: Study the following information to answer the questions.
In hotel B, the ratio of female customers on Tuesday and Friday was 2 : 3. If on Friday, female customers constituted 50% of the number of customers (male + female), then what was the number of customers (male + female) in hotel B on Friday?
1228 0609d1b598cf832661da7b4e1
609d1b598cf832661da7b4e1- 1282true
- 2276false
- 3288false
- 4296false
- 5294false
- Show AnswerHide Answer
- Workspace
- SingleChoice
Answer : 1. "282"
Q:Direction: Read the following graph carefully and answer the following questions:
The following bar graph shows the quantity(in kg) of wheat, rice, pulses and salts sold by two companies P and Q in the month of January.
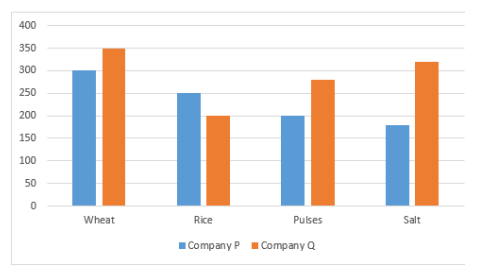
What is the ratio of the total quantity (in kg) of wheat and pulses sold by company P to company Q?
1227 064ddf36690a003851d0552c3
64ddf36690a003851d0552c3The following bar graph shows the quantity(in kg) of wheat, rice, pulses and salts sold by two companies P and Q in the month of January.
- 14:9false
- 24:5true
- 34:3false
- 45:4false
- 54:7false
- Show AnswerHide Answer
- Workspace
- SingleChoice
Answer : 2. "4:5"
Q:The table given below shows the information about bats manufactured by 6 different companies. Each company manufactures only plastic and wooden bats. Each company labels these bats as Brand A or Brand B. The table shows the number of plastic bats as a percentage of total bats manufactured by each company. It also shows the ratio of wooden bats labelled A and B. Each company manufactured a total 550000 bats.

N= wooden bats of brand B manufactured by U.
M= Total wooden bats manufactured by R and W together.
What is the value of N/M?
1225 05f30d792bcbb69394d1c9def
5f30d792bcbb69394d1c9defM= Total wooden bats manufactured by R and W together.
What is the value of N/M?
- 10.043false
- 20.061true
- 30.125false
- 40.087false
- Show AnswerHide Answer
- Workspace
- SingleChoice