Data Interpretation Questions Practice Question and Answer
8 Q:The circle-graph given here shows the spending of a country on various sports during a particular year. Study the graph carefully and answer the question given below it.
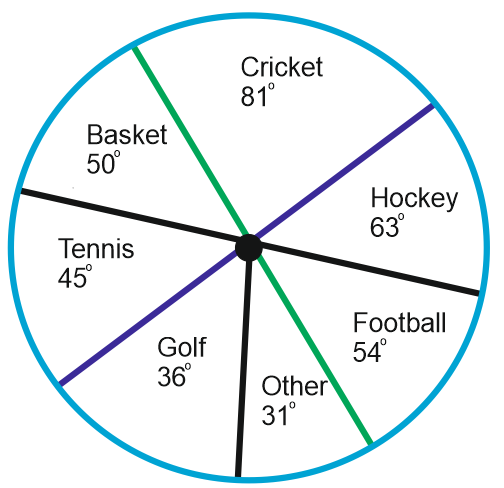
How much percent is less spent on Football than that on Cricket?
2304 05d70adc93b18207684daf2d9
5d70adc93b18207684daf2d9
- 1$$\left(22{2\over9} \right)\ $$%false
- 227%false
- 3$$33{1\over 3}\%$$true
- 430%false
- Show AnswerHide Answer
- Workspace
- SingleChoice
Answer : 3. "$$33{1\over 3}\%$$ "
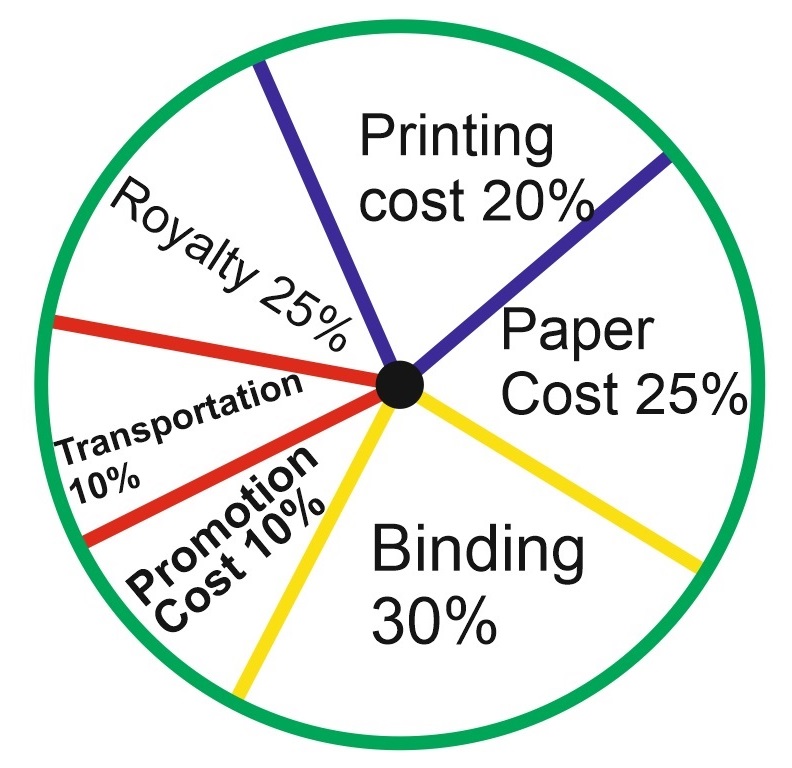
Q: What is the central angle of the sector corresponding to the expenditure incurred on Royalty?
2301 05d70c32960d0a53645a4795d
5d70c32960d0a53645a4795d
- 115°false
- 224°false
- 354°true
- 448°false
- Show AnswerHide Answer
- Workspace
- SingleChoice
Answer : 3. "54°"
Explanation :
Central angle corresponding to Royalty = (15% of 360)°= 54°
Q:Direction (94-98): Study the following table to answer the given questions.
Centre and Post-wise Numbered of candidate
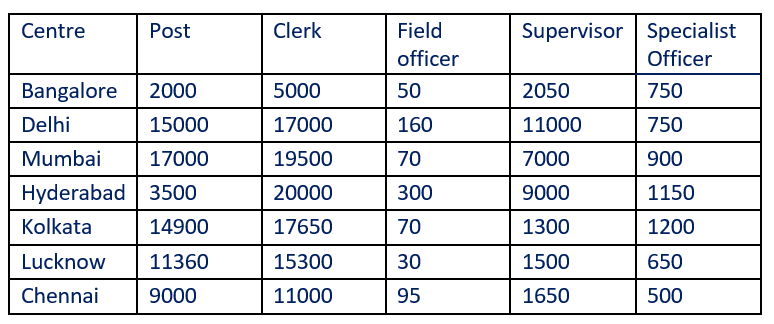
Which centre has 300% more number of Clerks as compared to Bangalore?
2299 05da402315225a412f5163767
5da402315225a412f5163767Centre and Post-wise Numbered of candidate
- 1Lucknowfalse
- 2Mumbaifalse
- 3Hyderabadfalse
- 4Chennaifalse
- 5None of thesetrue
- Show AnswerHide Answer
- Workspace
- SingleChoice
Answer : 5. "None of these"
Q:Directions : Given line graph shows the data of male & female population in 5 different cities. Read the data carefully and answer the questions.
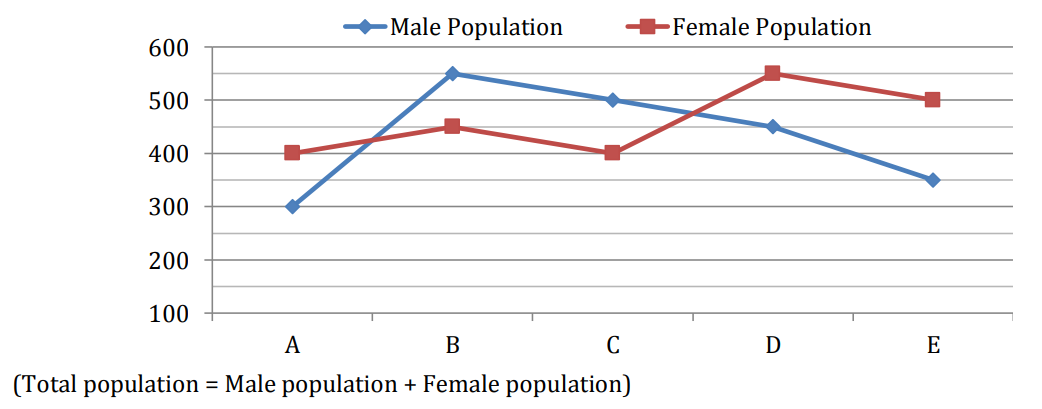
In city B & C, ratio of postgraduates is 7 : 8. Total population who is postgraduate in city B is equal to total population of city A. find ratio of non-postgraduate population in city B to that of city C.
2299 06040896ab0e8d85dadab69fc
6040896ab0e8d85dadab69fc- 17 : 3false
- 28 : 3false
- 37 : 1false
- 43 : 1true
- 58 : 1false
- Show AnswerHide Answer
- Workspace
- SingleChoice
Answer : 4. "3 : 1"
Q:Directions: The following graph gives Sales, Expense and Capital of a company for a period of five years 1994 to 1998. Read the graph and answer the following questions.
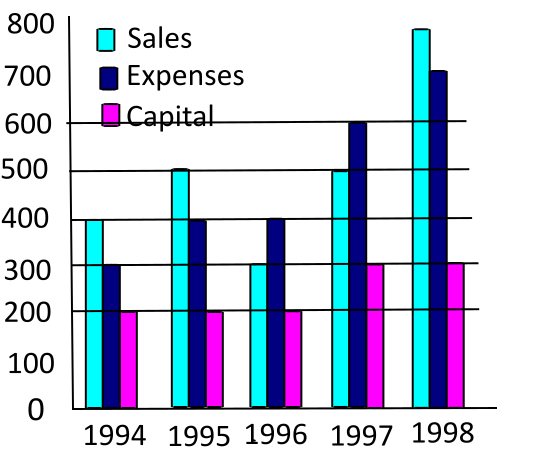
What has been the simple average growth rate per annum of expense between 1994 and 1998?
2299 05f40e287b8958f14fa2b6472
5f40e287b8958f14fa2b6472- 125%true
- 233%false
- 340%false
- 4130%false
- Show AnswerHide Answer
- Workspace
- SingleChoice
Answer : 1. "25%"
Q:Direction: The line chart given below shows the number of labors (men and women) working in six different years. Study the data carefully and answer the following questions.
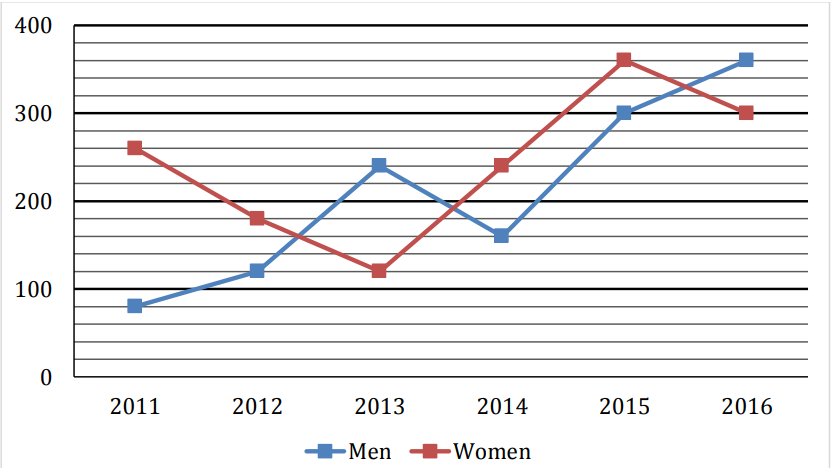
Total number of Men working in all six years is how much more/less than total number of Women working in all six years together?
2291 0603dcbd7ec464f505f27715e
603dcbd7ec464f505f27715e- 1180false
- 2200true
- 3140false
- 4160false
- 5None of the given optionsfalse
- Show AnswerHide Answer
- Workspace
- SingleChoice
Answer : 2. "200"
Q:Directions: The following pie-chart represents the result of 600 successful students in various subject of an examination. Study the Pie-chart and answer question.
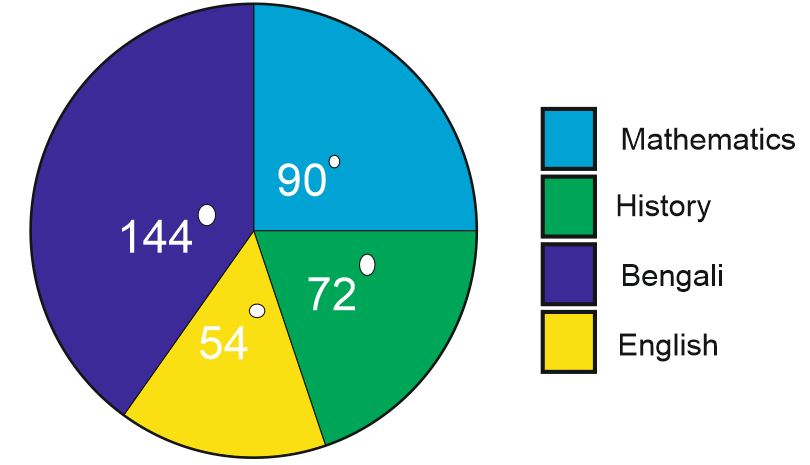
The number of students passed in Bengali is greater than the number of students passed in History by
2289 05ee301082bf4c40446491ce6
5ee301082bf4c40446491ce6- 1150false
- 260false
- 3120true
- 4100false
- Show AnswerHide Answer
- Workspace
- SingleChoice
Answer : 3. "120"
Q:Directions: The following pie-chart represents the result of 600 successful students in various subject of an examination. Study the Pie-chart and answer question.
The ratio of students who passed in Bengali, to the students who passed in History is
2260 05ee30031f72c0e153c805a7a
5ee30031f72c0e153c805a7a- 11 : 2false
- 22 : 1true
- 33 : 4false
- 43 : 5false
- Show AnswerHide Answer
- Workspace
- SingleChoice