Data Interpretation Questions Practice Question and Answer
8 Q:Directions-Study the following diagram and answer the four questions.
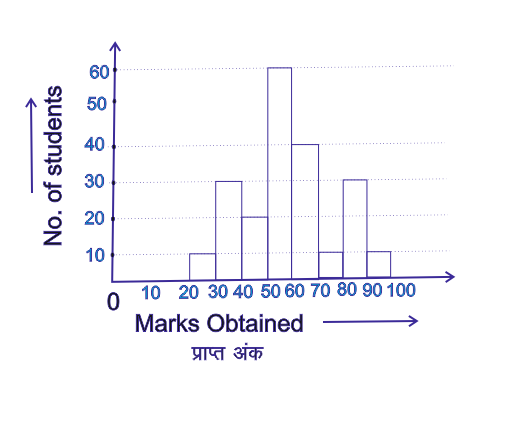
The range of marks obtained by maximum no. of students is
1721 05daea692cca75847f4d92d20
5daea692cca75847f4d92d20- 130-40false
- 260-70false
- 350-60true
- 480-90false
- Show AnswerHide Answer
- Workspace
- SingleChoice
Answer : 3. "50-60 "
Q:The circle-graph given here shows the spending of a country on various sports during a particular year. Study the graph carefully and answer the question given below it.
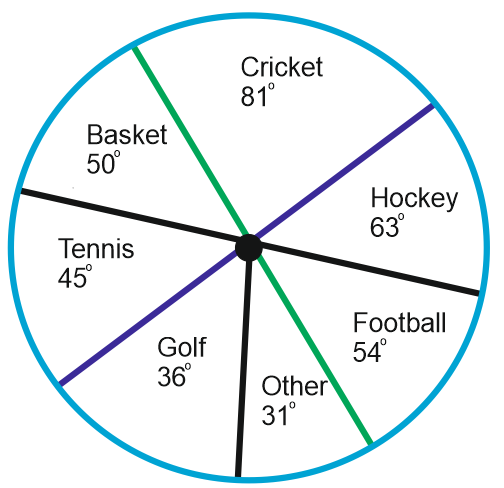
If the total amount spent on sports during the year be Rs. 1,80,00,000 the amount spent on Basketball exceeds that on Tennis by:
2193 05d70b20260d0a53645a46a8f
5d70b20260d0a53645a46a8f
- 1Rs. 2,50,000true
- 2Rs. 3,60,000false
- 3Rs. 3,75,000false
- 4Rs. 4,10,000false
- Show AnswerHide Answer
- Workspace
- SingleChoice
Answer : 1. "Rs. 2,50,000"
Q: Study the following graph and answer the question that follow.
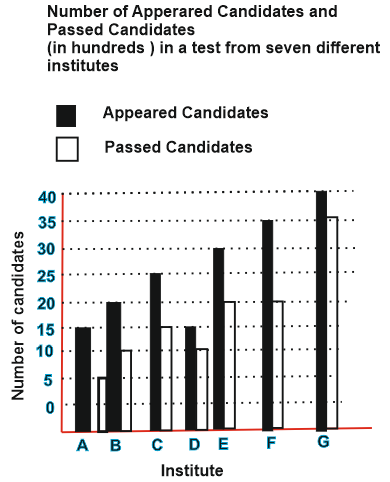 What is the respective ratio between the number of candidates who have failed from institute B and the number of candidates who have appeared from institute F?
2553 05d860deed0d7a00e4ecbb3b8
5d860deed0d7a00e4ecbb3b8What is the respective ratio between the number of candidates who have failed from institute B and the number of candidates who have appeared from institute F?- 11:7false
- 22:5false
- 32:7true
- 41:5false
- 5None of thesefalse
- Show AnswerHide Answer
- Workspace
- SingleChoice
Answer : 3. "2:7"
Q:Study the following pie-diagrams carefully and answer the question given below it.
PERCENTAGE COMPOSITION OF HUMAN BODY
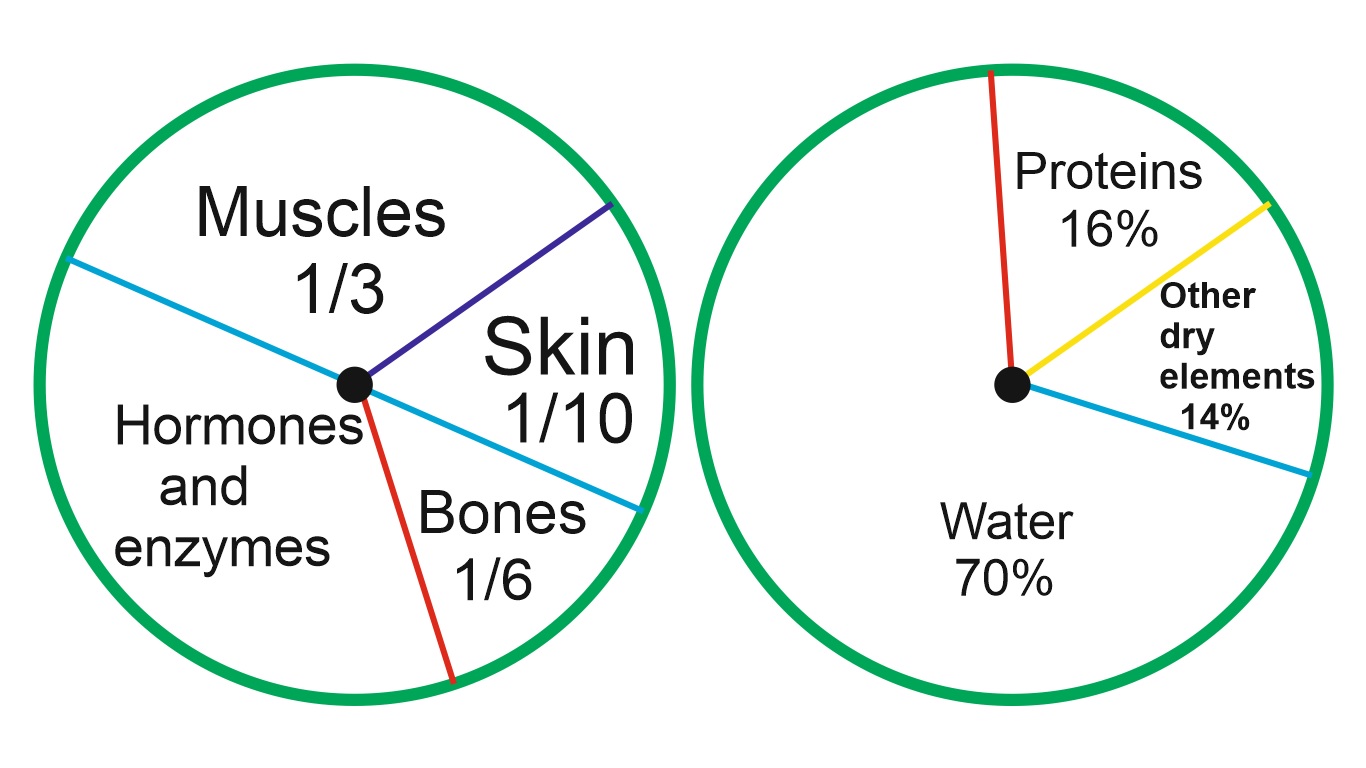
What is the ratio of the distribution of proteins in the muscles to that of the distribution of proteins in the bones? 3701 05c2ca3439fd00135a4b20f5e
5c2ca3439fd00135a4b20f5ePERCENTAGE COMPOSITION OF HUMAN BODY
- 11: 18false
- 21: 2false
- 32: 1true
- 418: 1false
- Show AnswerHide Answer
- Workspace
- SingleChoice
Answer : 3. "2: 1"
Q:The circle-graph given here shows the spending of a country on various sports during a particular year. Study the graph carefully and answer the question given below it.
How much percent is more spent on Hockey than that on Golf?
1996 05d70aacf9004b376a58bd1b3
5d70aacf9004b376a58bd1b3
- 127 %false
- 235 %false
- 337.5 %false
- 475 %true
- Show AnswerHide Answer
- Workspace
- SingleChoice
Answer : 4. "75 %"
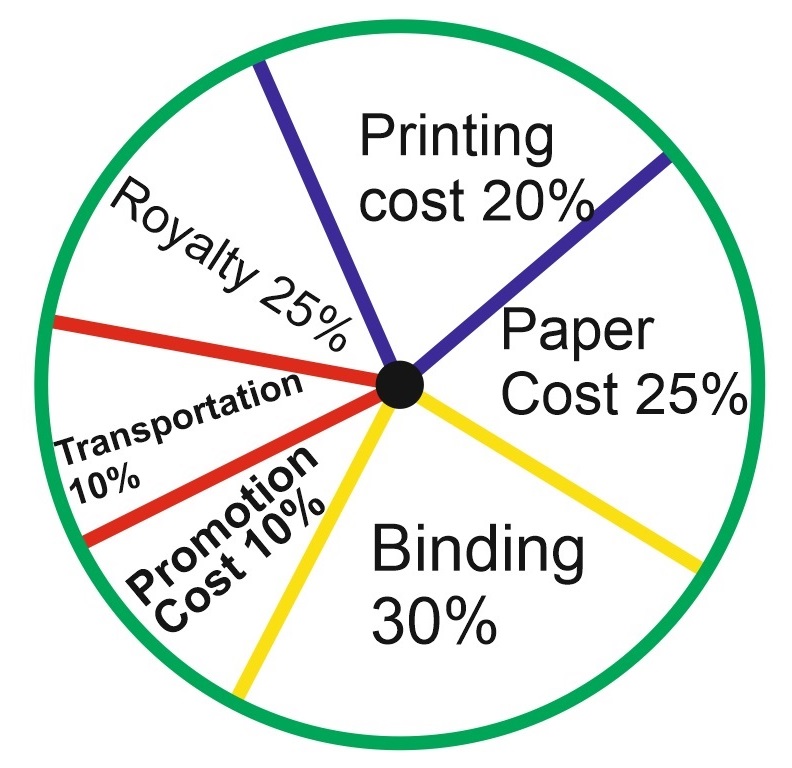
Q: If for a certain quantity of books, the publisher has to pay Rs. 30,600 as printing cost, then what will be the amount of royalty to be paid for these books?
2211 05d70b6cad8eebc768d112b28
5d70b6cad8eebc768d112b28
- 1Rs. 19,450false
- 2Rs. 21,200false
- 3Rs. 22,950true
- 4Rs. 26,150false
- Show AnswerHide Answer
- Workspace
- SingleChoice
Answer : 3. "Rs. 22,950"
Explanation :
Let the amount of Royalty to be paid for these books be Rs. p.
Then, 20 : 15 = 30600 : r ⇒ r = Rs. ![]() = Rs. 22950.
= Rs. 22950.
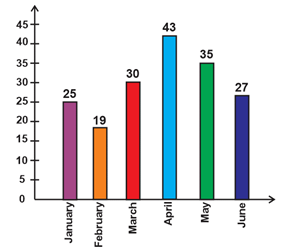
Q: The bar-chart is showing the number of Accidents in a city during the first six month of a year. Examine the bar chart and answer the following questions.
What is the percentage of accidents in the month of April to the total accidents in the city?
4692 05d775e76315eb75b14639a53
5d775e76315eb75b14639a53What is the percentage of accidents in the month of April to the total accidents in the city?
- 115%false
- 220%false
- 322%false
- 424%true
- Show AnswerHide Answer
- Workspace
- SingleChoice
Answer : 4. "24%"
Q:Direction: Study the double bar graph given below and answer the questions.
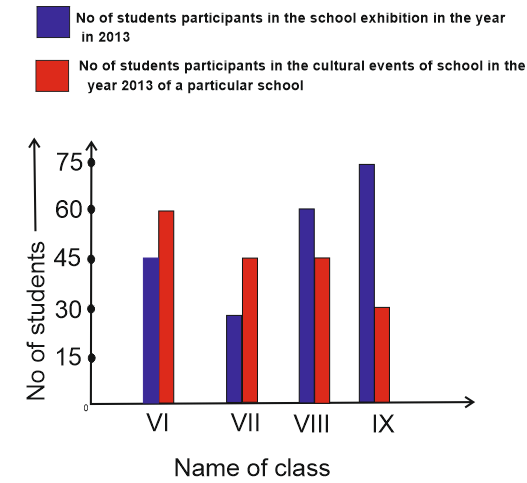
The class having maximum number of participants in exhibitions:
2036 05d932154c263b979273f36ac
5d932154c263b979273f36ac- 1Class IXtrue
- 2Class VIIIfalse
- 3Class VIIfalse
- 4Class VIfalse
- Show AnswerHide Answer
- Workspace
- SingleChoice