Data Interpretation Practice Question and Answer
8 Q: The bar graph shows the number of painting sold an art gallery in each month from January to June.
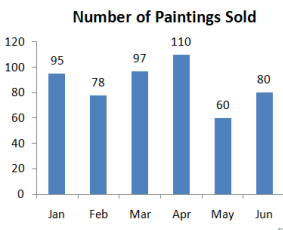
How many paintings does it need to sell in July for the 7 month average to be 90?
2040 060c09eb2c197293a48276046
60c09eb2c197293a48276046- 1115false
- 285false
- 390false
- 4110true
- Show AnswerHide Answer
- Workspace
- SingleChoice
Answer : 4. "110"
Q:Directions-Study the following diagram and answer the four questions.
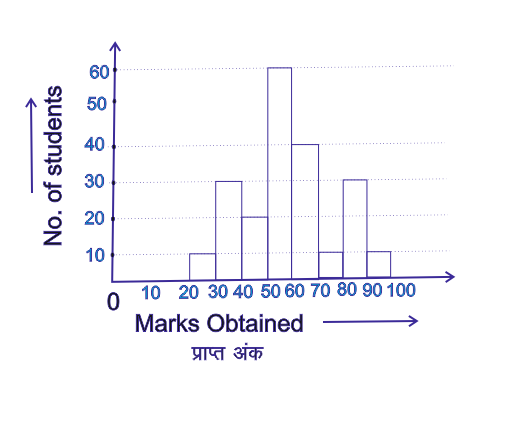
The percentage of students securing marks less than 50 is
2039 05daea745622dcb0d26318ea7
5daea745622dcb0d26318ea7- 1$$ 28{4\over 7}%$$true
- 2$$ 25{5\over 7}%$$%false
- 3$$ 23{13\over 21}%$$%false
- 4$$ 47{13\over 21}%$$%false
- Show AnswerHide Answer
- Workspace
- SingleChoice
Answer : 1. "$$ 28{4\over 7}%$$"
Q:Direction: Study the double bar graph given below and answer the questions.
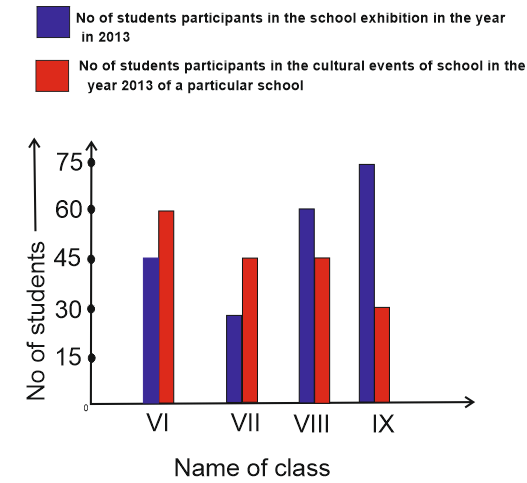
The class having maximum number of participants in exhibitions:
2037 05d932154c263b979273f36ac
5d932154c263b979273f36ac- 1Class IXtrue
- 2Class VIIIfalse
- 3Class VIIfalse
- 4Class VIfalse
- Show AnswerHide Answer
- Workspace
- SingleChoice
Answer : 1. "Class IX"
Q:Direction : Given here is a multiple bar diagram of the scores of four players in two innings. Study the diagram and answer the questions.
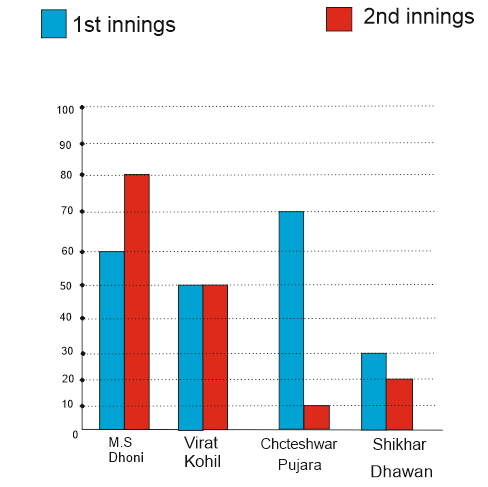
The total scores in the first innings contributed by the four players is :
2029 05da82f6db247ec0cc95f2b72
5da82f6db247ec0cc95f2b72- 1190false
- 2210true
- 3220false
- 4200false
- Show AnswerHide Answer
- Workspace
- SingleChoice
Answer : 2. "210 "
Q:Study the graph carefully and answer the following questions.
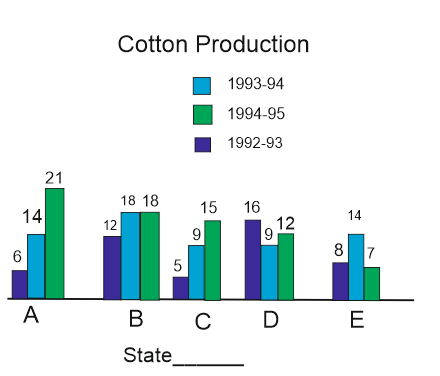
The production of State D in 1993-94 is how many times its production in 1994-95 ?
2028 05f1562f0cf79540a75340301
5f1562f0cf79540a75340301- 11.33false
- 20.75true
- 30.56false
- 41.77false
- Show AnswerHide Answer
- Workspace
- SingleChoice
Answer : 2. "0.75"
Q: The bar graph given below shows the production of sugar (in lakh tonnes) by two different companies P and Q for the given years.
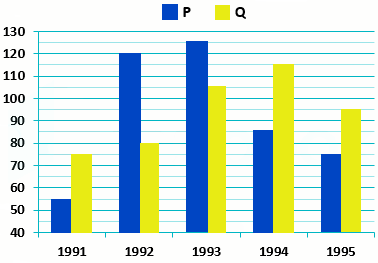
J1 = percentage increase in production of sugar of company P from 1991 to 1995.
J2 = percentage increase in production of sugar of company Q from 1992 to 1994.
What is the value of J1 + J2?
2015 06450ab5b13eb5908ae2dc657
6450ab5b13eb5908ae2dc657- 148 percentfalse
- 280.11 percenttrue
- 386.22 percentfalse
- 476.11 percentfalse
- Show AnswerHide Answer
- Workspace
- SingleChoice
Answer : 2. "80.11 percent"
Q: In a school of 1200, students were asked how they travelled to school. The information obtained is depicted by a pie-chart as below. From the given information find how many students come to school by Car?
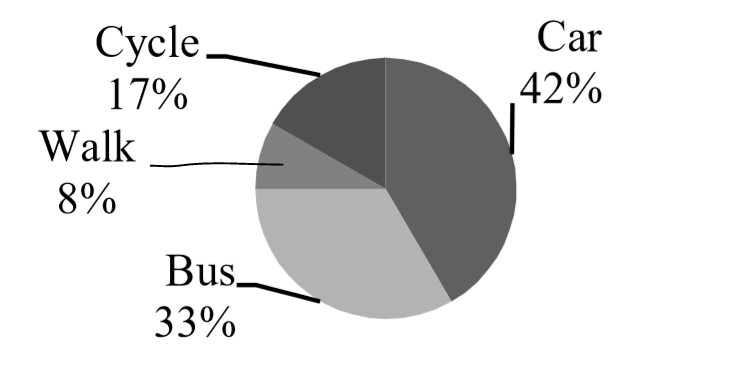
2005 05ebcc5347fbed1167f1cf2ae
5ebcc5347fbed1167f1cf2ae- 11000false
- 2504true
- 3900false
- 4750false
- Show AnswerHide Answer
- Workspace
- SingleChoice
Answer : 2. "504 "
Q:The circle-graph given here shows the spending of a country on various sports during a particular year. Study the graph carefully and answer the question given below it.
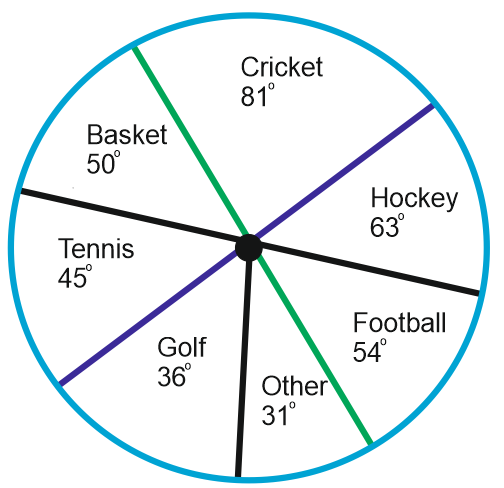
How much percent is more spent on Hockey than that on Golf?
1996 05d70aacf9004b376a58bd1b3
5d70aacf9004b376a58bd1b3
- 127 %false
- 235 %false
- 337.5 %false
- 475 %true
- Show AnswerHide Answer
- Workspace
- SingleChoice