Data Interpretation Practice Question and Answer
8 Q:Directions: The line graph shows the number of work visas issued by a country in each year from 2011 to 2016. Study the diagram and answer the following questions .
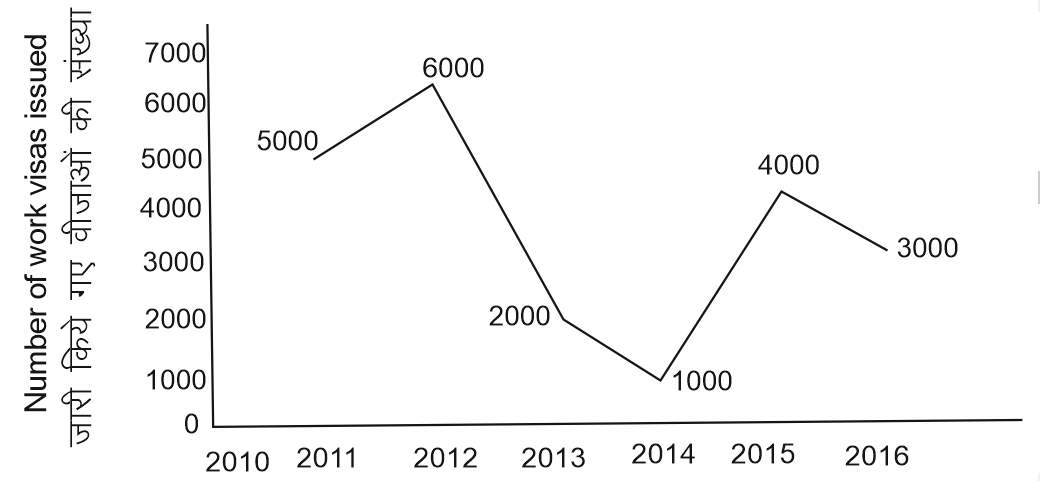
What is the total number of visas issued from 2012 to 2015 ?
1190 05ed9ef8be11a1c4b43e6e3b0
5ed9ef8be11a1c4b43e6e3b0- 113000true
- 218000false
- 316000false
- 47000false
- Show AnswerHide Answer
- Workspace
- SingleChoice
Answer : 1. "13000 "
Q:Table below shows the number of candidates appearing for the interview and the percentage of candidates found eligible for the post in various companies (A, B, C, D, E, F).
Study the Tables and give answer the following Questions.
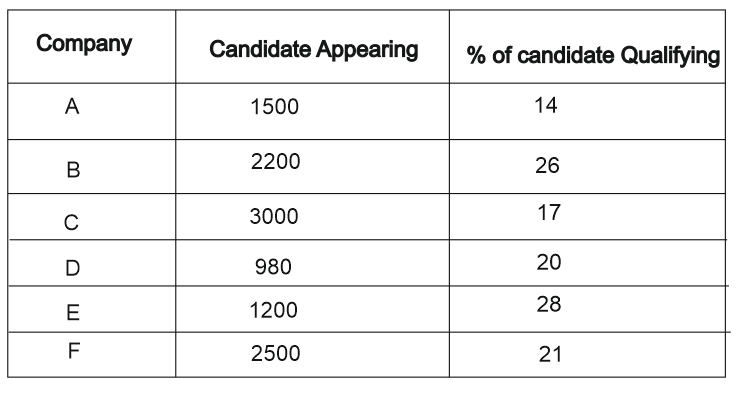
What is the respective ratio between the number of qualified candidates in Company A and the number of candidates qualified in Company E?
1188 05f1e725ca844e17b150ccfc7
5f1e725ca844e17b150ccfc7Study the Tables and give answer the following Questions.
- 12:5false
- 23:7false
- 35:8true
- 45:6false
- Show AnswerHide Answer
- Workspace
- SingleChoice
Answer : 3. "5:8"
Q:Direction : The table given below represents number of bikes of five different brands sold from 2001- 2005, with the help of data given in the table, answer the following questions.
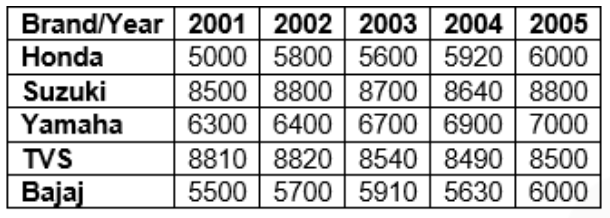
In how many years the increase of selling is greater than 10% for any brand?
1187 060a4ee64b1d2440614c02ef0
60a4ee64b1d2440614c02ef0- 11true
- 22false
- 33false
- 44false
- 5None of thesefalse
- Show AnswerHide Answer
- Workspace
- SingleChoice
Answer : 1. "1 "
Q:The given table represents the number of engineers recruited by four companies A, B, C and D over the years. Study the table carefully and answer the question that follow.
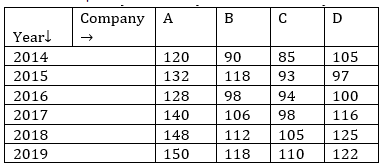
The total number of engineers recruited by company A in 2014 to 2017 is what percentage more than the total number of engineers recruited by all four companies in 2019?
1184 060927140bef26c5d152b8bfe
60927140bef26c5d152b8bfe- 13.5false
- 22.5false
- 33false
- 44true
- Show AnswerHide Answer
- Workspace
- SingleChoice
Answer : 4. "4"
Q:Read the following graph carefully and answer the related questions-
Total number of students (in thousands) participating in comitative exam in various cities.
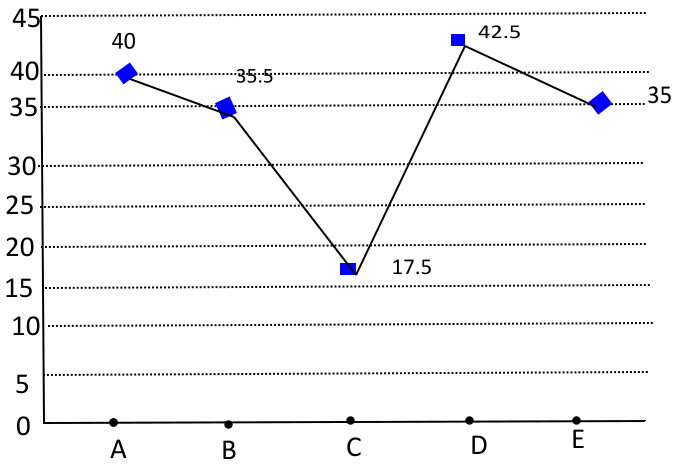
What is the ratio of number of students appearing tor competitive exam from city B to number of students appearing for competitive exam from city A?
1183 0602377822dc71d4148a571bd
602377822dc71d4148a571bd- 13:4false
- 213:16false
- 311:16false
- 4None of thesetrue
- Show AnswerHide Answer
- Workspace
- SingleChoice
Answer : 4. "None of these "
Q:Directions: Study the following table carefully to answer the questions that follow Number of Gold coins (in hundred) produced in Five Different companies during Six Different month.
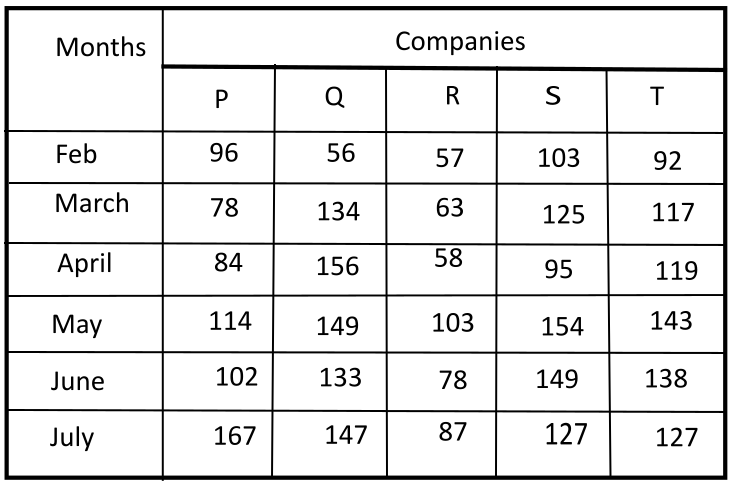
What was the total number of Gold coins produced from all the companies together in the month of march?
1182 05fd9c7a489d4575ab490c20a
5fd9c7a489d4575ab490c20a- 153500false
- 251700true
- 35.15 thousandfalse
- 451500false
- 5None of thesefalse
- Show AnswerHide Answer
- Workspace
- SingleChoice
Answer : 2. "51700"
Q:Direction: The given Bar Graph Presents the number of different types of vehicles (in lakhs) exported by a company during 2014 and 2015.
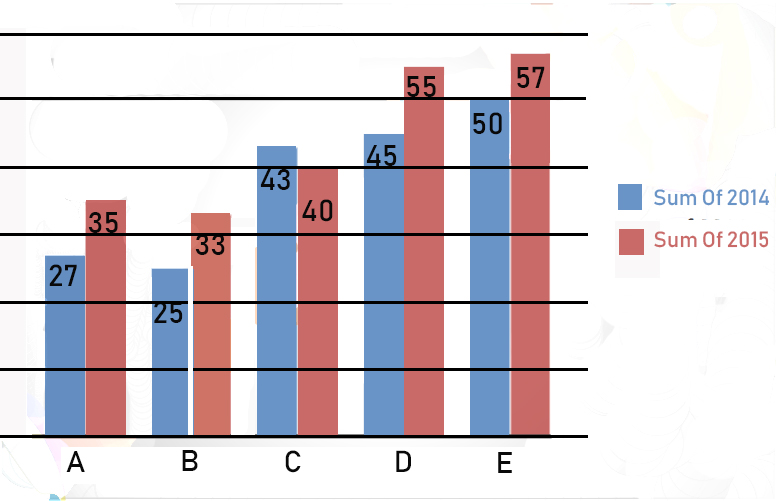
Which type of vehicle showed a 32% increase in export in 2015 as compared to that in the previous year?
1182 060251372cce66f776c87be6b
60251372cce66f776c87be6b- 1Btrue
- 2Afalse
- 3Efalse
- 4Dfalse
- Show AnswerHide Answer
- Workspace
- SingleChoice
Answer : 1. "B"
Q:Directions : Given here is a pie chart showing the cost of gold in 2010, 2011, 2012 and 2013. Study the chart and answer the following questions
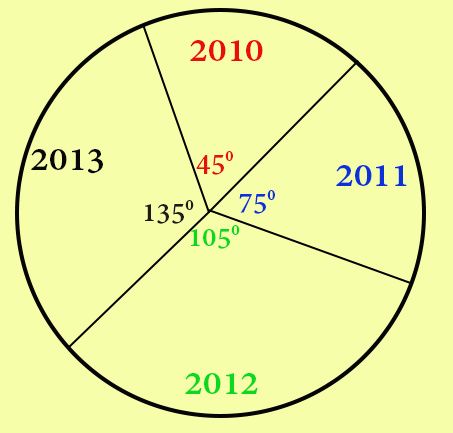
The ratio of the price of gold in the two years 2010 and 2013 is
1182 064539d6f13eb5908ae3544d5
64539d6f13eb5908ae3544d5- 11 : 2false
- 21 : 3true
- 31 : 4false
- 41 : 5false
- Show AnswerHide Answer
- Workspace
- SingleChoice