Data Interpretation Practice Question and Answer
8 Q:The following Charts shows the amount of grain exported (in million kg ) by a country during 2013–18.

In which year did jute exports become the highest?
1687 05f645298becdf06fd26560ad
5f645298becdf06fd26560ad- 12014false
- 22016false
- 32018true
- 42017false
- Show AnswerHide Answer
- Workspace
- SingleChoice
Answer : 3. "2018"
Q:The following Charts shows the amount of grain exported (in million kg ) by a country during 2013–18.
What is the maximum per cent more than the minimum export in the given period?
1414 05f64523eca371c728314febd
5f64523eca371c728314febd- 1100 %true
- 250 %false
- 375 %false
- 466.67 %false
- Show AnswerHide Answer
- Workspace
- SingleChoice
Answer : 1. "100 %"
Q:The line graph shows the number of vacancies of accountants in a certain company. Study the diagram and answer the following questions.
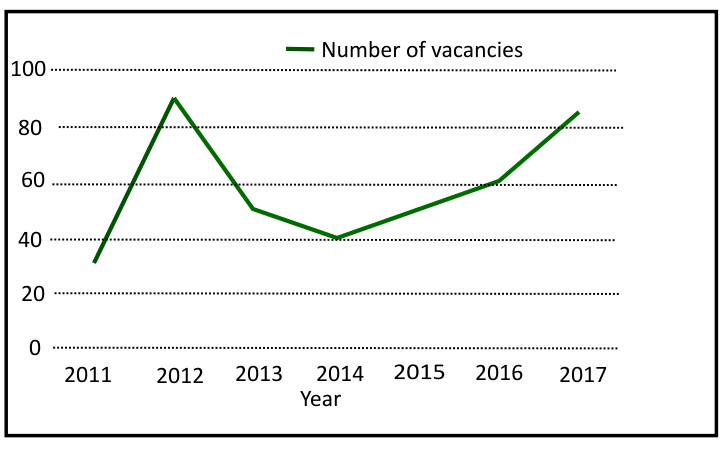
What is the average of the total vacancies?
1392 05f5b0f7769ed13038c1a9a5f
5f5b0f7769ed13038c1a9a5f- 158.58false
- 258.57true
- 360false
- 455false
- Show AnswerHide Answer
- Workspace
- SingleChoice
Answer : 2. "58.57"
Q:The line graph shows the number of vacancies of accountants in a certain company. Study the diagram and answer the following questions.
What is the different between maximum and minimum vacancies?
1399 05f5b0e26dc518b408a4241fc
5f5b0e26dc518b408a4241fc- 130false
- 260true
- 380false
- 440false
- Show AnswerHide Answer
- Workspace
- SingleChoice
Answer : 2. "60"
Q:The line graph shows the number of vacancies of accountants in a certain company. Study the diagram and answer the following questions.
In which year maximum vacancies produced?
1278 05f5b0d2869ed13038c1a8a01
5f5b0d2869ed13038c1a8a01- 12012, 2017true
- 22014, 2016false
- 32013, 2016false
- 4None of thesefalse
- Show AnswerHide Answer
- Workspace
- SingleChoice
Answer : 1. "2012, 2017"
Q:The line graph shows the number of vacancies of accountants in a certain company. Study the diagram and answer the following questions.
Between which two years is the rate of decrement in vacancies is maximum?
1464 05f5b079c69ed13038c1a6f39
5f5b079c69ed13038c1a6f39- 12013-2014false
- 22012-2015false
- 32012-2014false
- 42012-2013true
- Show AnswerHide Answer
- Workspace
- SingleChoice
Answer : 4. "2012-2013"
Q:The line graph shows the number of vacancies of accountants in a certain company. Study the diagram and answer the following questions.
By what percent does the vacancies got increased in year 2016 from 2011?
1371 05f5b068a69ed13038c1a5fef
5f5b068a69ed13038c1a5fef- 180%false
- 2100%true
- 360%false
- 440%false
- Show AnswerHide Answer
- Workspace
- SingleChoice
Answer : 2. "100%"
Q:Directions : The graph shows the demand and production of different companies. Study the graph and answer the following questions.
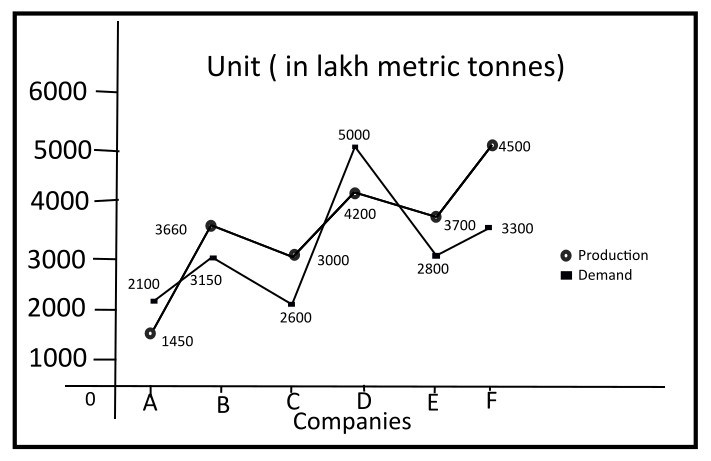
What is the lowest production company?
1279 05f4f73630c72eb2349337ad6
5f4f73630c72eb2349337ad6- 1Cfalse
- 2Dfalse
- 3Ffalse
- 4Atrue
- Show AnswerHide Answer
- Workspace
- SingleChoice