Data Interpretation Practice Question and Answer
8 Q:Directions : The graph shows the demand and production of different companies. Study the graph and answer the following questions.
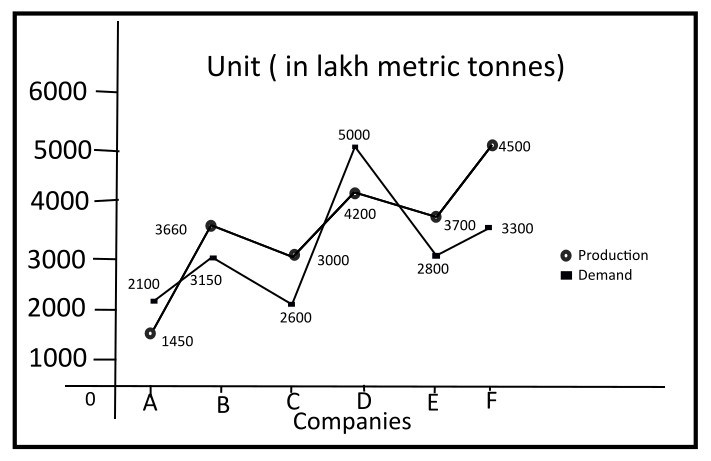
What is the second large demand company?
1294 05f4f730882a7582d892c7ab9
5f4f730882a7582d892c7ab9- 1Ftrue
- 2Bfalse
- 3Afalse
- 4Dfalse
- Show AnswerHide Answer
- Workspace
- SingleChoice
Answer : 1. "F"
Q:Directions : The graph shows the demand and production of different companies. Study the graph and answer the following questions.
The production of company A is approximately what percent of the demand of company C?
1109 05f4f72990c72eb234933723c
5f4f72990c72eb234933723c- 150%false
- 260%false
- 355 %true
- 465%false
- Show AnswerHide Answer
- Workspace
- SingleChoice
Answer : 3. "55 %"
Q:Directions : The graph shows the demand and production of different companies. Study the graph and answer the following questions.
The demand of company B is what percentage of the production of company F ?
1472 05f4f72000c72eb2349336a22
5f4f72000c72eb2349336a22- 150%false
- 270%true
- 380%false
- 460%false
- Show AnswerHide Answer
- Workspace
- SingleChoice
Answer : 2. "70%"
Q:Directions : The graph shows the demand and production of different companies. Study the graph and answer the following questions.
What is the ratio of companies with high demand to production and companies with less than production?
1360 05f4f71b87e85226ee74c45d7
5f4f71b87e85226ee74c45d7- 11:2true
- 22:3false
- 32:1false
- 43:2false
- Show AnswerHide Answer
- Workspace
- SingleChoice
Answer : 1. "1:2"
Q:Directions: The following graph gives Sales, Expense and Capital of a company for a period of five years 1994 to 1998. Read the graph and answer the following questions.
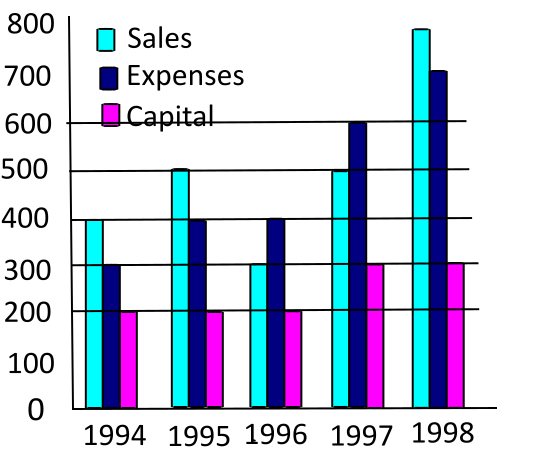
In which year was the ratio of sales to capital the lowest?
1322 05f40e6549b782961da3f964a
5f40e6549b782961da3f964a- 11998false
- 21997false
- 31996true
- 41995false
- Show AnswerHide Answer
- Workspace
- SingleChoice
Answer : 3. "1996"
Q:Directions: The following graph gives Sales, Expense and Capital of a company for a period of five years 1994 to 1998. Read the graph and answer the following questions.
In which year was the ratio of profits to capital the highest?
1244 05f40e5d69b782961da3f9518
5f40e5d69b782961da3f9518- 11998false
- 21995true
- 31996false
- 41997false
- Show AnswerHide Answer
- Workspace
- SingleChoice
Answer : 2. "1995"
Q:Directions: The following graph gives Sales, Expense and Capital of a company for a period of five years 1994 to 1998. Read the graph and answer the following questions.
What was the average per annum increase in sales (in Rs. Cr.) from 1994 to 1998?
1268 05f40e3984c9a9415f7ce2acd
5f40e3984c9a9415f7ce2acd- 150false
- 260false
- 380true
- 4100false
- Show AnswerHide Answer
- Workspace
- SingleChoice
Answer : 3. "80"
Q:Directions: The following graph gives Sales, Expense and Capital of a company for a period of five years 1994 to 1998. Read the graph and answer the following questions.
In which year was the Sales to Expense ratio the lowest?
1368 05f40e2e89b782961da3f873c
5f40e2e89b782961da3f873c- 11994false
- 21996true
- 31997false
- 41998false
- Show AnswerHide Answer
- Workspace
- SingleChoice