Data Interpretation Practice Question and Answer
8 Q:Directions : Given here is a pie chart showing the cost of gold in 2010, 2011, 2012 and 2013. Study the chart and answer the following questions
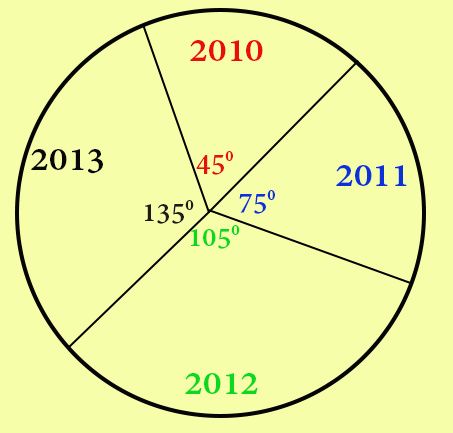
The ratio of the price of gold in the two years 2010 and 2013 is
1182 064539d6f13eb5908ae3544d5
64539d6f13eb5908ae3544d5- 11 : 2false
- 21 : 3true
- 31 : 4false
- 41 : 5false
- Show AnswerHide Answer
- Workspace
- SingleChoice
Answer : 2. "1 : 3"
Q:Directions : The graph shows the demand and production of different companies. Study the graph and answer the following questions.
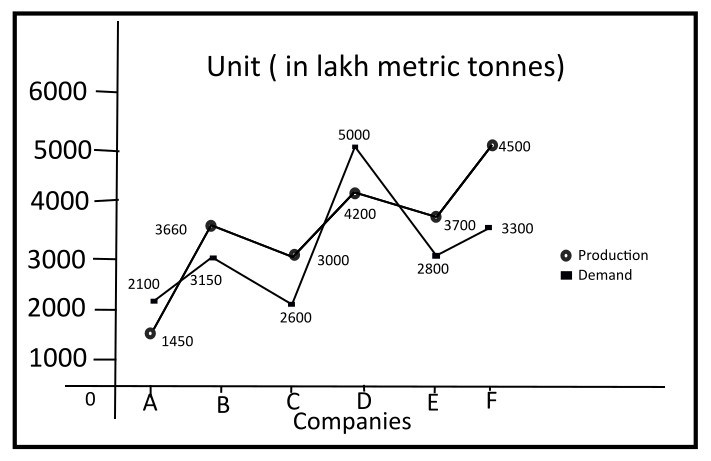
What is the lowest production company?
1181 05f4f73630c72eb2349337ad6
5f4f73630c72eb2349337ad6- 1Cfalse
- 2Dfalse
- 3Ffalse
- 4Atrue
- Show AnswerHide Answer
- Workspace
- SingleChoice
Answer : 4. "A"
Q:Directions : Study the following frequency polygon and answer the questions. Given a line graph showing the number of students passed in Higher Secondary Examination in a school over the years 2008 to 2013.

The decrease in percentage of passed students from 2011 to 2012 approximately is
1180 0639321a558400a550de27e18
639321a558400a550de27e18- 18.25%false
- 28.27%false
- 38.24%true
- 48.22%false
- Show AnswerHide Answer
- Workspace
- SingleChoice
Answer : 3. "8.24% "
Q:Direction: The following table shows the number of students of 7 colleges A, B, C, D, E, F, G participating in extra-curricular activities :
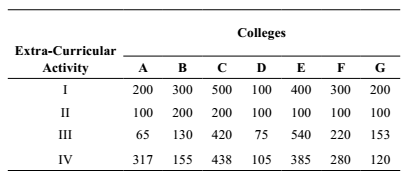
Percentage of the number of students in activity II to that of IV is ?
1179 0601147efaf82aa3010a2f6fc
601147efaf82aa3010a2f6fc- 137false
- 242false
- 348false
- 450true
- Show AnswerHide Answer
- Workspace
- SingleChoice
Answer : 4. "50"
Q:Study the graphs to answer these questions.
The pie chart shows the percentage of graduate employees in various department of M/S XYZ limited.
The employees in various departments of M/S. XYZ limited. Other than graduate employees are those employees who are either post graduate or undergraduates.

The number of graduate employees in Administration and Production together is how many times other than graduate employees in Marketing and Finance together?
1178 060114302af82aa3010a2ea48
60114302af82aa3010a2ea48The pie chart shows the percentage of graduate employees in various department of M/S XYZ limited.
The employees in various departments of M/S. XYZ limited. Other than graduate employees are those employees who are either post graduate or undergraduates.
- 13.5false
- 20.285true
- 30.445false
- 40.215false
- Show AnswerHide Answer
- Workspace
- SingleChoice
Answer : 2. "0.285 "
Q:The following table shows the number of units of product produced and sold by a company during six years.
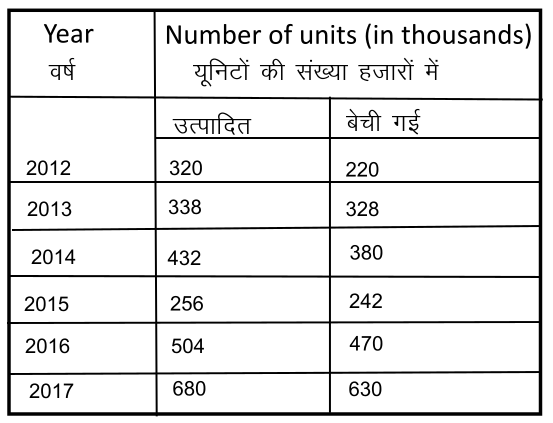
What is the difference between the number of units produced in 2017 and the number of units sold in 2014?
1177 05f6d9bcdf9079a64e3bfd8e6
5f6d9bcdf9079a64e3bfd8e6- 1320false
- 2340false
- 390false
- 4300true
- Show AnswerHide Answer
- Workspace
- SingleChoice
Answer : 4. "300"
Q:Direction: Study the pie chart carefully and answer the given questions. The pie chart shows the percentage breakup of students in different classes from VI to X in the year 2017
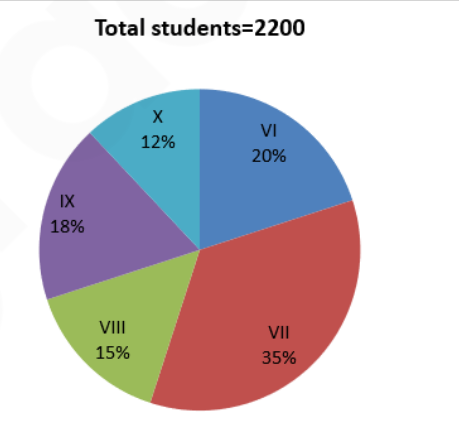
If in 2018, the total number of students in class VI and class VII is increased by 10% each and the total number of students in class VIII is decreased by 20% then what is the difference between the total number of students in class VI and VII together in 2018 to that of the total number of students in class VIII in 2018?
1175 060a257bcde4c2e1331dbeaa4
60a257bcde4c2e1331dbeaa4- 11078false
- 2878false
- 3976false
- 41067true
- 51156false
- Show AnswerHide Answer
- Workspace
- SingleChoice
Answer : 4. "1067"
Q:Study the given graph and answer the question that follows.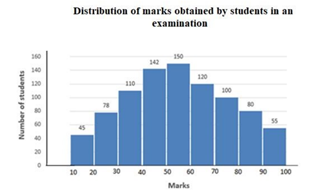
If 60% of the total number of students obtaining 50 marks or more but less than 70 marks are girls and 55 % of the total number of students obtaining 70 marks or more but less than 90 marks are also girls. Then the total number of girls obtaining 50 marks or more but less than 90 marks is:
1164 0605326834999e13f2a6d25ae
605326834999e13f2a6d25ae- 1261true
- 2207false
- 3236false
- 4257false
- Show AnswerHide Answer
- Workspace
- SingleChoice