Data Interpretation Practice Question and Answer
8 Q:Directions: The following graph gives Sales, Expense and Capital of a company for a period of five years 1994 to 1998. Read the graph and answer the following questions.
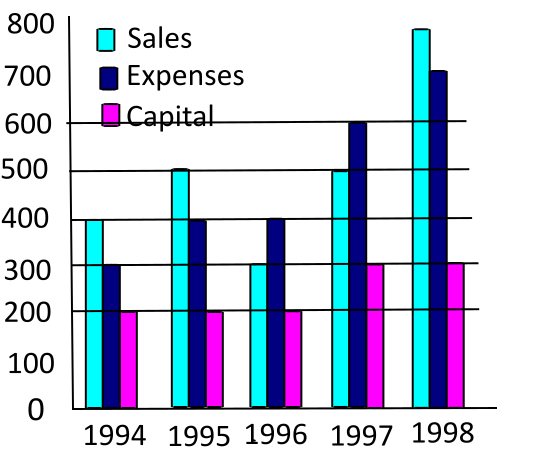
What has been the simple average growth rate per annum of expense between 1994 and 1998?
2119 05f40e287b8958f14fa2b6472
5f40e287b8958f14fa2b6472- 125%true
- 233%false
- 340%false
- 4130%false
- Show AnswerHide Answer
- Workspace
- SingleChoice
Answer : 1. "25%"
Q:The table given below shows the information about bats manufactured by 6 different companies. Each company manufactures only plastic and wooden bats. Each company labels these bats as Brand A or Brand B. The table shows the number of plastic bats as a percentage of total bats manufactured by each company. It also shows the ratio of wooden bats labelled A and B. Each company manufactured a total 550000 bats.

X= Average of plastic bats manufactured by V, U and T.
Y=Wooden bats of Brand A manufactured by V.
What is the value X – Y?
1618 05f30d8dfbcbb69394d1ca4d8
5f30d8dfbcbb69394d1ca4d8Y=Wooden bats of Brand A manufactured by V.
What is the value X – Y?
- 1197600false
- 2432890false
- 3260000true
- 4293300false
- Show AnswerHide Answer
- Workspace
- SingleChoice
Answer : 3. "260000"
Q:The table given below shows the information about bats manufactured by 6 different companies. Each company manufactures only plastic and wooden bats. Each company labels these bats as Brand A or Brand B. The table shows the number of plastic bats as a percentage of total bats manufactured by each company. It also shows the ratio of wooden bats labelled A and B. Each company manufactured a total 550000 bats.
Taking all 6 companies together, how many wooden bats of Brand A have been produced?
1218 05f30d866bcbb69394d1ca3a7
5f30d866bcbb69394d1ca3a7- 1691000true
- 2724000false
- 3683000false
- 4716000false
- Show AnswerHide Answer
- Workspace
- SingleChoice
Answer : 1. "691000"
Q:The table given below shows the information about bats manufactured by 6 different companies. Each company manufactures only plastic and wooden bats. Each company labels these bats as Brand A or Brand B. The table shows the number of plastic bats as a percentage of total bats manufactured by each company. It also shows the ratio of wooden bats labelled A and B. Each company manufactured a total 550000 bats.
P=sum of wooden bats of Brand B manufactured by S and wooden bats of Brand A manufactured by W.
Q= Difference of Brand B wooden bats and Brand A wooden bats manufactured by U.
What is the value of P - Q ?
1231 05f30d80ebcbb69394d1c9f66
5f30d80ebcbb69394d1c9f66Q= Difference of Brand B wooden bats and Brand A wooden bats manufactured by U.
What is the value of P - Q ?
- 167,500false
- 217,7700false
- 315,9500true
- 412,3500false
- Show AnswerHide Answer
- Workspace
- SingleChoice
Answer : 3. "15,9500"
Q:The table given below shows the information about bats manufactured by 6 different companies. Each company manufactures only plastic and wooden bats. Each company labels these bats as Brand A or Brand B. The table shows the number of plastic bats as a percentage of total bats manufactured by each company. It also shows the ratio of wooden bats labelled A and B. Each company manufactured a total 550000 bats.
N= wooden bats of brand B manufactured by U.
M= Total wooden bats manufactured by R and W together.
What is the value of N/M?
1164 05f30d792bcbb69394d1c9def
5f30d792bcbb69394d1c9defM= Total wooden bats manufactured by R and W together.
What is the value of N/M?
- 10.043false
- 20.061true
- 30.125false
- 40.087false
- Show AnswerHide Answer
- Workspace
- SingleChoice
Answer : 2. "0.061"
Q:The table given below shows the information about bats manufactured by 6 different companies. Each company manufactures only plastic and wooden bats. Each company labels these bats as Brand A or Brand B. The table shows the number of plastic bats as a percentage of total bats manufactured by each company. It also shows the ratio of wooden bats labelled A and B. Each company manufactured a total 550000 bats.
What is the total number of wooden bats of brand A manufactured by company T?
1148 05f30d291c006da57832960d6
5f30d291c006da57832960d6- 123,420false
- 222,990false
- 368,920false
- 472,600true
- Show AnswerHide Answer
- Workspace
- SingleChoice
Answer : 4. "72,600"
Q:Table below shows the number of candidates appearing for the interview and the percentage of candidates found eligible for the post in various companies (A, B, C, D, E, F).
Study the Tables and give answer the following Questions.
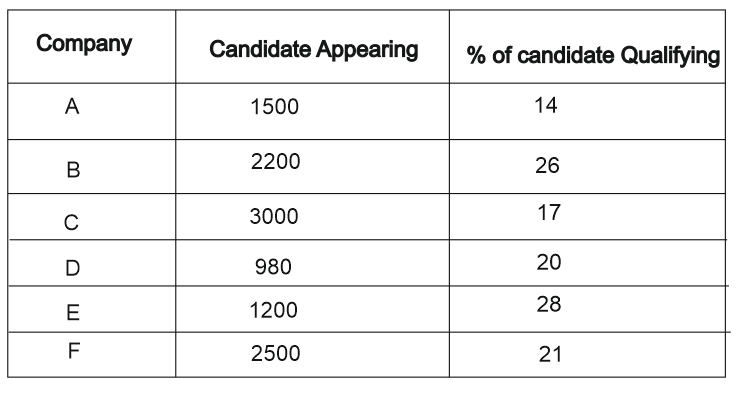
How many qualified candidates are there in Company F?
1061 05f1e75591b4d8003eeb07229
5f1e75591b4d8003eeb07229Study the Tables and give answer the following Questions.
- 1525true
- 2520false
- 3530false
- 4540false
- Show AnswerHide Answer
- Workspace
- SingleChoice
Answer : 1. "525"
Q:Table below shows the number of candidates appearing for the interview and the percentage of candidates found eligible for the post in various companies (A, B, C, D, E, F).
Study the Tables and give answer the following Questions.
Which company has the lowest number of candidates appearing in the interview?
1130 05f1e750126299776aa40b0bb
5f1e750126299776aa40b0bbStudy the Tables and give answer the following Questions.
- 1Efalse
- 2Dtrue
- 3Cfalse
- 4Afalse
- Show AnswerHide Answer
- Workspace
- SingleChoice