Data Interpretation Practice Question and Answer
8 Q:The table given below shows the information about bats manufactured by 6 different companies. Each company manufactures only plastic and wooden bats. Each company labels these bats as Brand A or Brand B. The table shows the number of plastic bats as a percentage of total bats manufactured by each company. It also shows the ratio of wooden bats labelled A and B. Each company manufactured a total 550000 bats.

N= wooden bats of brand B manufactured by U.
M= Total wooden bats manufactured by R and W together.
What is the value of N/M?
1164 05f30d792bcbb69394d1c9def
5f30d792bcbb69394d1c9defM= Total wooden bats manufactured by R and W together.
What is the value of N/M?
- 10.043false
- 20.061true
- 30.125false
- 40.087false
- Show AnswerHide Answer
- Workspace
- SingleChoice
Answer : 2. "0.061"
Q:Direction: The bar graph shows revenues in rupees lakhs from selling four different products (A, B, C and D) by a certain company. Study the diagram and answer the following questions.
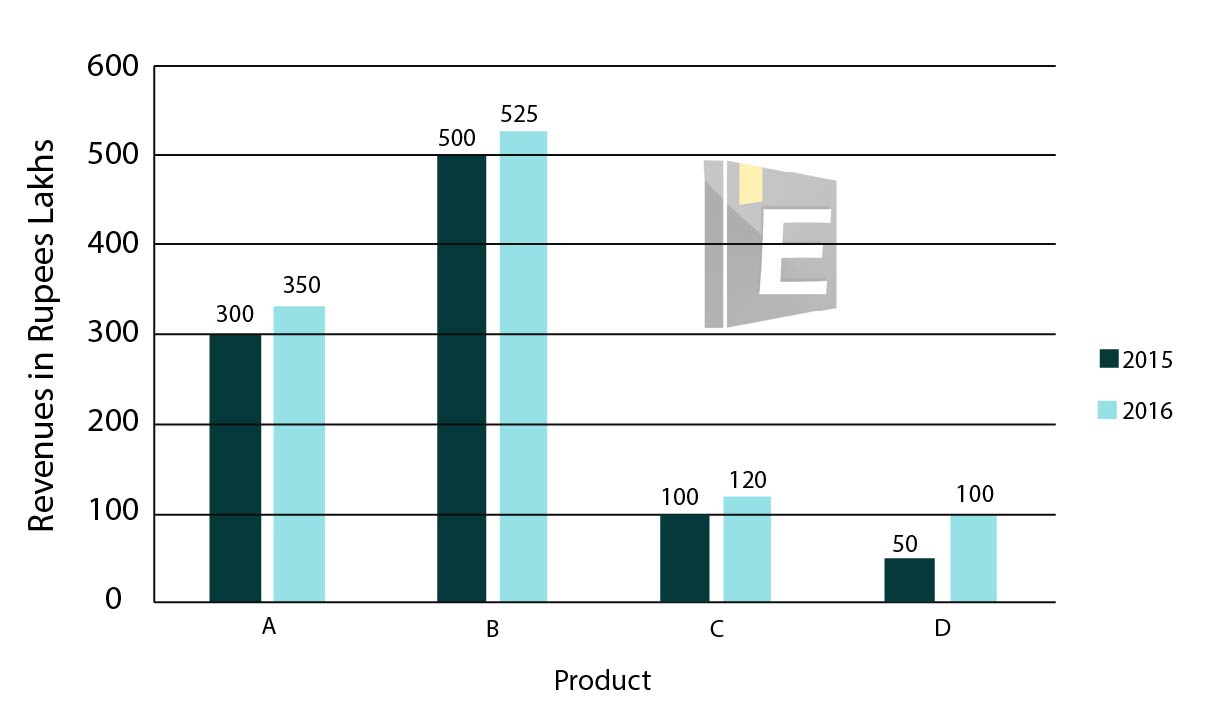
By what value (in %) the revenue from sale of product B in 2016 was greater than that of 2015?
1161 0619f6879d129fc6243ae9488
619f6879d129fc6243ae9488- 10.5false
- 25true
- 325false
- 425false
- Show AnswerHide Answer
- Workspace
- SingleChoice
Answer : 2. "5"
Q:Direction: Study the following information to answer the questions.
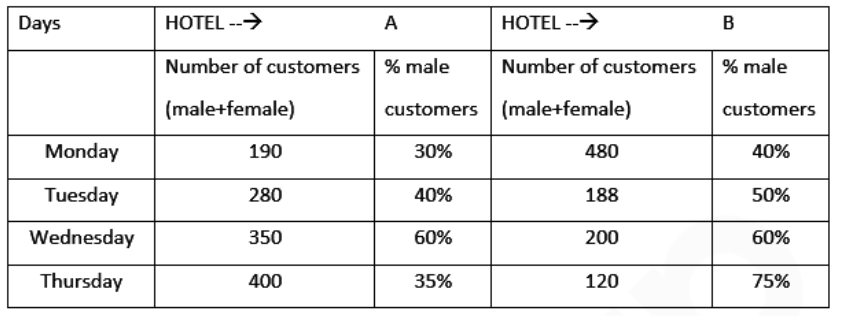
The number of customers (male + female) in hotel A and B are increased by 50% and 15% respectively from Thursday to Saturday. If the total number of female customers in hotel A and B together was equal on Thursday and Saturday, what was the total number of male customers in hotel A and B together on Saturday?
1161 0609d1aa3e941dd6183d638e3
609d1aa3e941dd6183d638e3- 1448true
- 2452false
- 3458false
- 4438false
- 5442false
- Show AnswerHide Answer
- Workspace
- SingleChoice
Answer : 1. "448"
Q:Study the given pie chart and answer the question that follows.
Distribution (Degree wise) of students studying in schools A, B, C, D and E
Total Number of students =9000
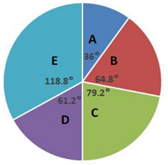
If the ratio of the number of boys to that of girls in school C is 6 : 5 and that in school B is 7 : 11,then what is the ratio of the number of boys in school C to the number of girls in school B?
1159 060532a75528a962d2e430021
60532a75528a962d2e430021Distribution (Degree wise) of students studying in schools A, B, C, D and E
Total Number of students =9000
- 110 : 11false
- 211 : 10false
- 312 : 11true
- 411: 12false
- Show AnswerHide Answer
- Workspace
- SingleChoice
Answer : 3. "12 : 11"
Q:The line graph shows the number of vacancies of accountants in a certain company. Study the diagram and answer the following questions.
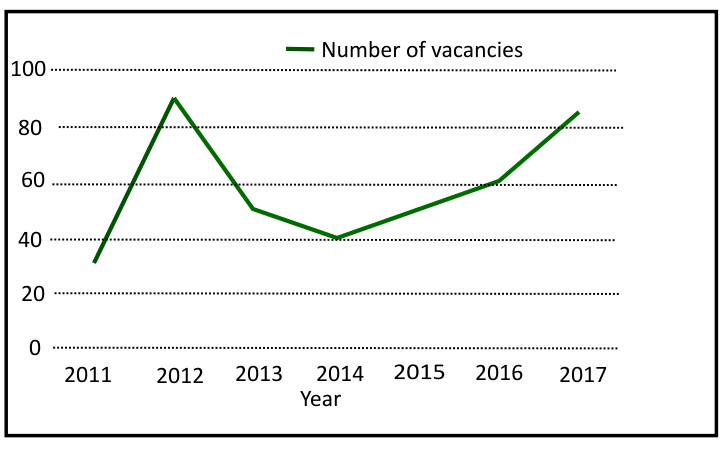
In which year maximum vacancies produced?
1159 05f5b0d2869ed13038c1a8a01
5f5b0d2869ed13038c1a8a01- 12012, 2017true
- 22014, 2016false
- 32013, 2016false
- 4None of thesefalse
- Show AnswerHide Answer
- Workspace
- SingleChoice
Answer : 1. "2012, 2017"
Q:Directions: The Pie chart given here represents the domestic expenditure of a family in per cent. Study the chart and answer the following questions if the total monthly income of the family is ₹ 33,650.
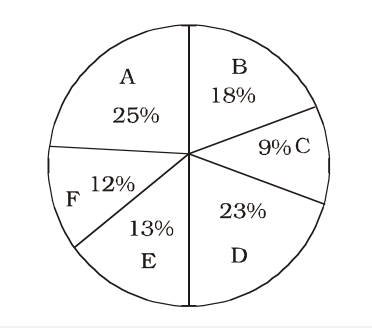
A: Expenditure on food
B: Expenditure on house-rent
C: Expenditure on entertainment
D: Expenditure on education and maintenance of children
E: Medical and miscellaneous expenditure
F: Deductions towards provident fund
The annual savings in the form of provident fund would be
1157 0638f310334f83f147297f6fb
638f310334f83f147297f6fb- 1₹ 48,456true
- 2₹ 48,540false
- 3₹ 44,856false
- 4₹ 45,480false
- Show AnswerHide Answer
- Workspace
- SingleChoice
Answer : 1. "₹ 48,456 "
Q:Directions: Read the below data carefully and answer the following questions.
The table shows the total number of ice cream (Chocobar + Cornetto) was given by Santa Claus on the day of Xmas to 5 children. It also shows the number of Chocobar ice-creams is how much more or less percentage of the total number of Cornetto ice-creams.
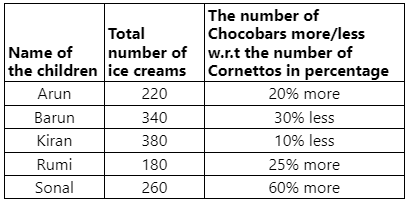
The number of Chocobar ice creams that Sonal had been what percent of the number of Cornetto ice creams she had?
1154 064dcc905d02c5c746bf6bd31
64dcc905d02c5c746bf6bd31The table shows the total number of ice cream (Chocobar + Cornetto) was given by Santa Claus on the day of Xmas to 5 children. It also shows the number of Chocobar ice-creams is how much more or less percentage of the total number of Cornetto ice-creams.
- 1120false
- 2150false
- 3160true
- 4130false
- 5None of thesefalse
- Show AnswerHide Answer
- Workspace
- SingleChoice
Answer : 3. "160"
Q:Direction: Study the line graph carefully to answer the following questions.
Line graph shows the production (in thousand units) and percentage of exported mobiles, computers and laptops.
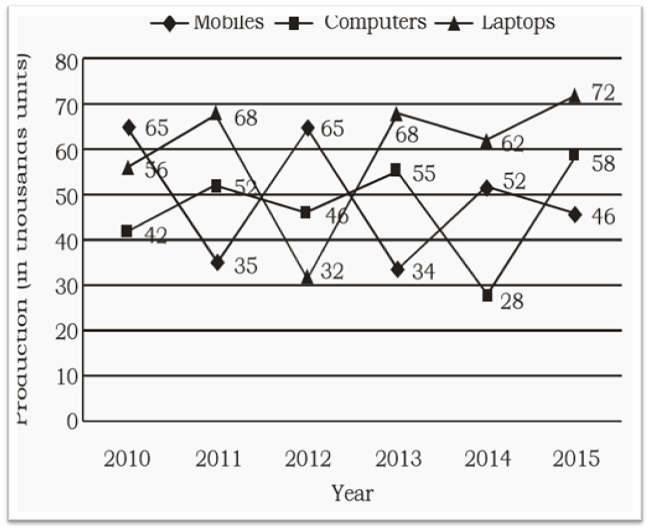
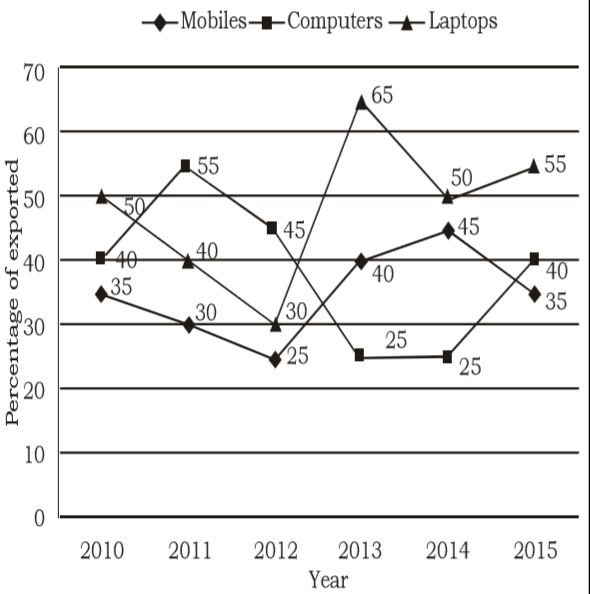
Find the total number Mobiles exported in the year 2011, 2013 and 2015 together?
1153 05e9d1c5e0a165a45b7580c29
5e9d1c5e0a165a45b7580c29Line graph shows the production (in thousand units) and percentage of exported mobiles, computers and laptops.
- 140,200true
- 242,010false
- 341,998false
- 440,960false
- 5None of thesefalse
- Show AnswerHide Answer
- Workspace
- SingleChoice