Data Interpretation Practice Question and Answer
8 Q:Study the table and answer the questions and give answer the following questions.
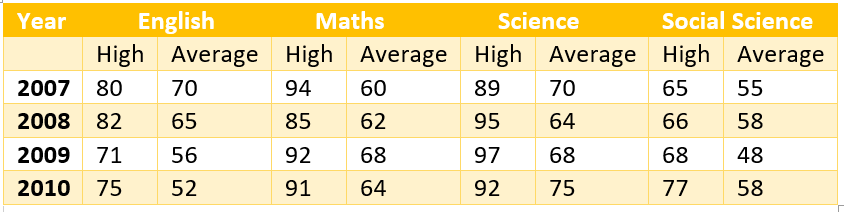
In which year , the difference between the highest and the average marks in maths was maximum?
1968 05eec8745985769334140bd68
5eec8745985769334140bd68- 12007false
- 22009false
- 32008true
- 42010false
- Show AnswerHide Answer
- Workspace
- SingleChoice
Answer : 3. "2008"
Q:Study the table and answer the questions and give answer the following questions.
Supposing that there were 40 students in sciences in the year 2009. How much total of marks did they receive combined together?
1930 05eec85e6eee45c3b837fa9ef
5eec85e6eee45c3b837fa9ef- 12800false
- 22720true
- 32560false
- 43000false
- Show AnswerHide Answer
- Workspace
- SingleChoice
Answer : 2. "2720"
Q:Study the table and answer the questions and give answer the following questions.
What is the overall average of marks in the four subjects in the year 2009?
2214 05eec856413d72d584fb845ff
5eec856413d72d584fb845ff- 163false
- 265false
- 364false
- 460true
- Show AnswerHide Answer
- Workspace
- SingleChoice
Answer : 4. "60"
Q:Directions: The following pie-chart represents the result of 600 successful students in various subject of an examination. Study the Pie-chart and answer question.
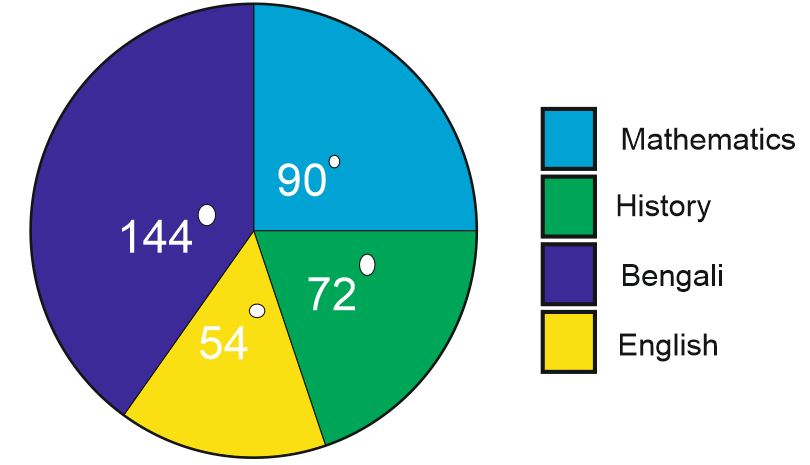
The number of students who passed in Bengali is –
2001 05ee30248e9ea010382e7e3d2
5ee30248e9ea010382e7e3d2- 1240true
- 2320false
- 3180false
- 4140false
- Show AnswerHide Answer
- Workspace
- SingleChoice
Answer : 1. "240"
Q:Directions: The following pie-chart represents the result of 600 successful students in various subject of an examination. Study the Pie-chart and answer question.
The number of students passed in English is less than the number of students passed in Mathematics by
1672 05ee301b7f72c0e153c805ae4
5ee301b7f72c0e153c805ae4- 150false
- 260true
- 390false
- 475false
- Show AnswerHide Answer
- Workspace
- SingleChoice
Answer : 2. "60"
Q:Directions: The following pie-chart represents the result of 600 successful students in various subject of an examination. Study the Pie-chart and answer question.
The percentage of students who passed in English is
2478 05ee3016e2bf4c40446491e93
5ee3016e2bf4c40446491e93- 115%true
- 220%false
- 35%false
- 412%false
- Show AnswerHide Answer
- Workspace
- SingleChoice
Answer : 1. "15%"
Q:Directions: The following pie-chart represents the result of 600 successful students in various subject of an examination. Study the Pie-chart and answer question.
The number of students passed in Bengali is greater than the number of students passed in History by
2144 05ee301082bf4c40446491ce6
5ee301082bf4c40446491ce6- 1150false
- 260false
- 3120true
- 4100false
- Show AnswerHide Answer
- Workspace
- SingleChoice
Answer : 3. "120"
Q:Directions: The following pie-chart represents the result of 600 successful students in various subject of an examination. Study the Pie-chart and answer question.
The ratio of students who passed in Bengali, to the students who passed in History is
2163 05ee30031f72c0e153c805a7a
5ee30031f72c0e153c805a7a- 11 : 2false
- 22 : 1true
- 33 : 4false
- 43 : 5false
- Show AnswerHide Answer
- Workspace
- SingleChoice