Data Interpretation Practice Question and Answer
8 Q:Direction : The table given below represents number of bikes of five different brands sold from 2001- 2005, with the help of data given in the table, answer the following questions.
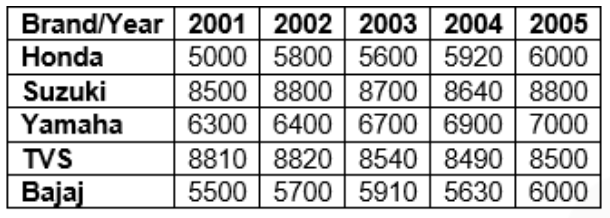
If sales of Suzuki in the year 2006 is increased by 5% and sales of Yamaha decreased by 5%, then what is the difference of averages of sales of Suzuki in year 2001 and 2006 and average sales of Yamaha in 2002 and 2006?
1123 060a4f033f98a5977251a2404
60a4f033f98a5977251a2404- 11170false
- 22000false
- 32330false
- 42345true
- 5None of thesefalse
- Show AnswerHide Answer
- Workspace
- SingleChoice
Answer : 4. "2345"
Q:Directions: Read the below data carefully and answer the following questions.
The table shows the total number of ice cream (Chocobar + Cornetto) was given by Santa Claus on the day of Xmas to 5 children. It also shows the number of Chocobar ice-creams is how much more or less percentage of the total number of Cornetto ice-creams.
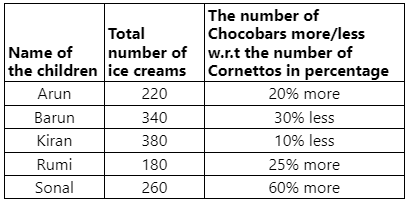
Find the ratio between the total number of Chocobars Arun, Kiran and Rumi have and the total number of Cornetto Barun and Sonal have.
1123 064dccaec462ecdc3adb582fb
64dccaec462ecdc3adb582fbThe table shows the total number of ice cream (Chocobar + Cornetto) was given by Santa Claus on the day of Xmas to 5 children. It also shows the number of Chocobar ice-creams is how much more or less percentage of the total number of Cornetto ice-creams.
- 11 ∶ 2false
- 22 ∶ 3false
- 33 ∶ 4false
- 44 ∶ 3true
- 5None of thesefalse
- Show AnswerHide Answer
- Workspace
- SingleChoice
Answer : 4. "4 ∶ 3"
Q:Table below shows the number of candidates appearing for the interview and the percentage of candidates found eligible for the post in various companies (A, B, C, D, E, F).
Study the Tables and give answer the following Questions.
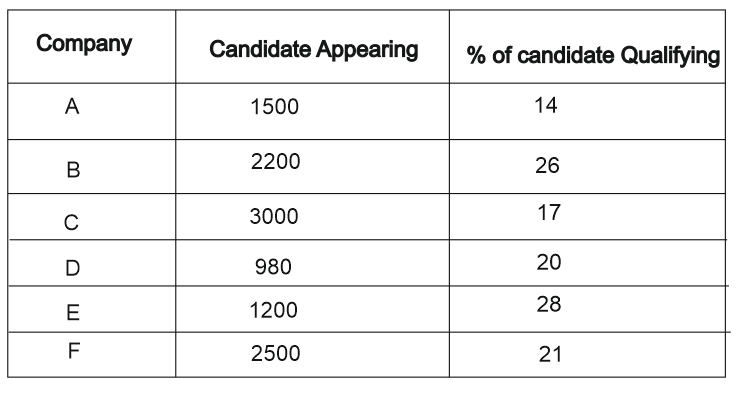
How many qualified candidates are there in Company D?
1123 05f1e72cb3b87486bfc539040
5f1e72cb3b87486bfc539040Study the Tables and give answer the following Questions.
- 1109false
- 2190false
- 3198false
- 4196true
- Show AnswerHide Answer
- Workspace
- SingleChoice
Answer : 4. "196"
Q:Read the following graph carefully and answer the related questions-
Total number of students (in thousands) participating in comitative exam in various cities.
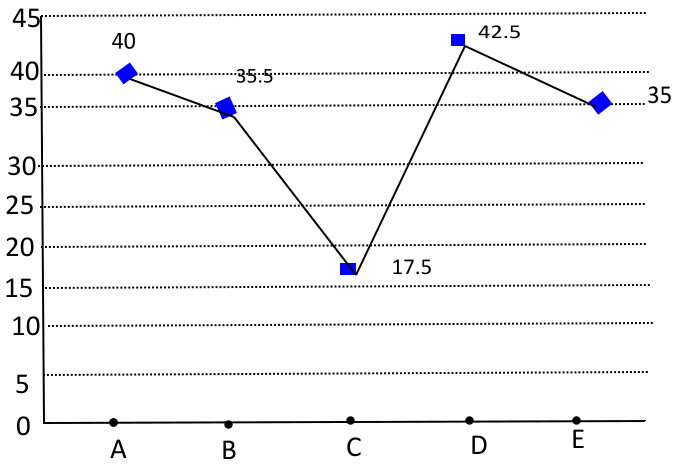
What is the ratio of number of students appearing for competitive exam from city C and D together to those appearing from A, D and E together?
1122 060237ccbad295556282de8c5
60237ccbad295556282de8c5- 111:13false
- 220:43false
- 324:47true
- 437:20false
- Show AnswerHide Answer
- Workspace
- SingleChoice
Answer : 3. "24:47 "
Q:Directions : In an Institution there are 800 students. Students use different modes of transport for going to the institution and return. The given pie diagram represents the requisite data. Study the diagram carefully and answer the questions.

The number of students who do not use institute bus is
1122 063ac3322e541fa7a013045e0
63ac3322e541fa7a013045e0- 1330false
- 2350false
- 3480false
- 4320true
- Show AnswerHide Answer
- Workspace
- SingleChoice
Answer : 4. "320 "
Q:Directions: Read the below data carefully and answer the following questions.
The table shows the total number of ice cream (Chocobar + Cornetto) was given by Santa Claus on the day of Xmas to 5 children. It also shows the number of Chocobar ice-creams is how much more or less percentage of the total number of Cornetto ice-creams.
Find the difference between the total number of Cornettoes all of them have and the total number of Chocobars everyone has.
1120 064dccb6580ef1e74b4edcf82
64dccb6580ef1e74b4edcf82The table shows the total number of ice cream (Chocobar + Cornetto) was given by Santa Claus on the day of Xmas to 5 children. It also shows the number of Chocobar ice-creams is how much more or less percentage of the total number of Cornetto ice-creams.
- 115false
- 220true
- 330false
- 445false
- 5None of thesefalse
- Show AnswerHide Answer
- Workspace
- SingleChoice
Answer : 2. "20"
Q:Directions : A bar graph showing the heights of six mountain peaks is given below. Study the bar graph and answer the questions.

What is the respective ratio of the heights of the highest peak and the lowest peak?
1111 063930cba9dda13791d7446a2
63930cba9dda13791d7446a2- 122 : 15true
- 215 : 22false
- 320 : 13false
- 413 : 22false
- Show AnswerHide Answer
- Workspace
- SingleChoice
Answer : 1. "22 : 15 "
Q:Directions : The graph shows the demand and production of different companies. Study the graph and answer the following questions.
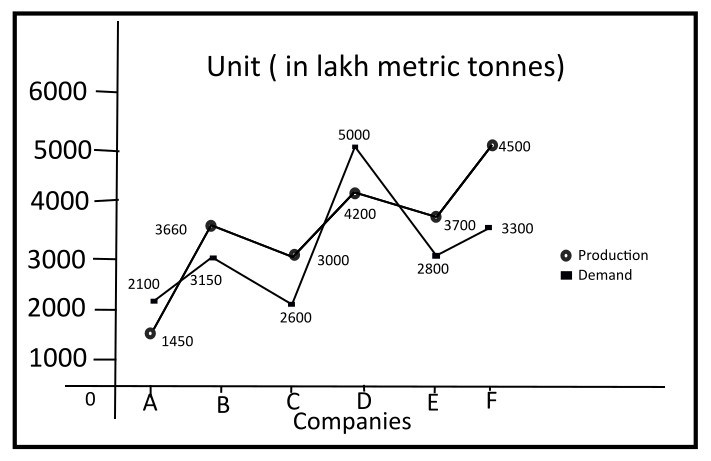
The production of company A is approximately what percent of the demand of company C?
1109 05f4f72990c72eb234933723c
5f4f72990c72eb234933723c- 150%false
- 260%false
- 355 %true
- 465%false
- Show AnswerHide Answer
- Workspace
- SingleChoice