Data Interpretation Practice Question and Answer
8 Q:Directions: The Bar Graph given here shows the population (in crores) of India in various census years. Observe the graph and answer the question based on it.
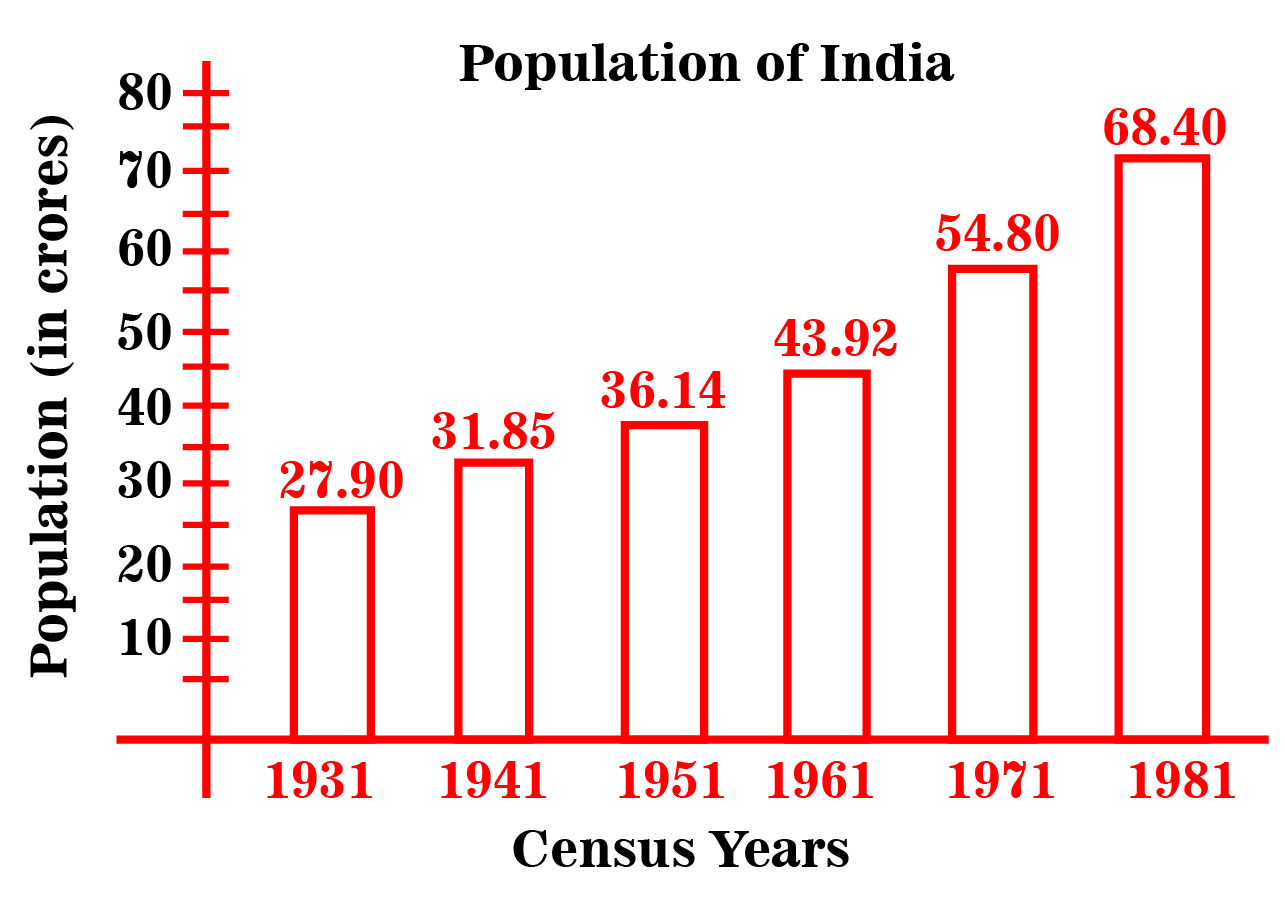
Per year increase in population from the year 1931 to 1981 is
3179 05ea8124ec8dec64c00978d98
5ea8124ec8dec64c00978d98- 18100000true
- 27600000false
- 38900000false
- 46700000false
- 5None of thesefalse
- Show AnswerHide Answer
- Workspace
- SingleChoice
Answer : 1. "8100000 "
Q:Directions: The bar graph, given here, shows the number of tickets sold by 6 students A, B, C, D, E and F during a fair.
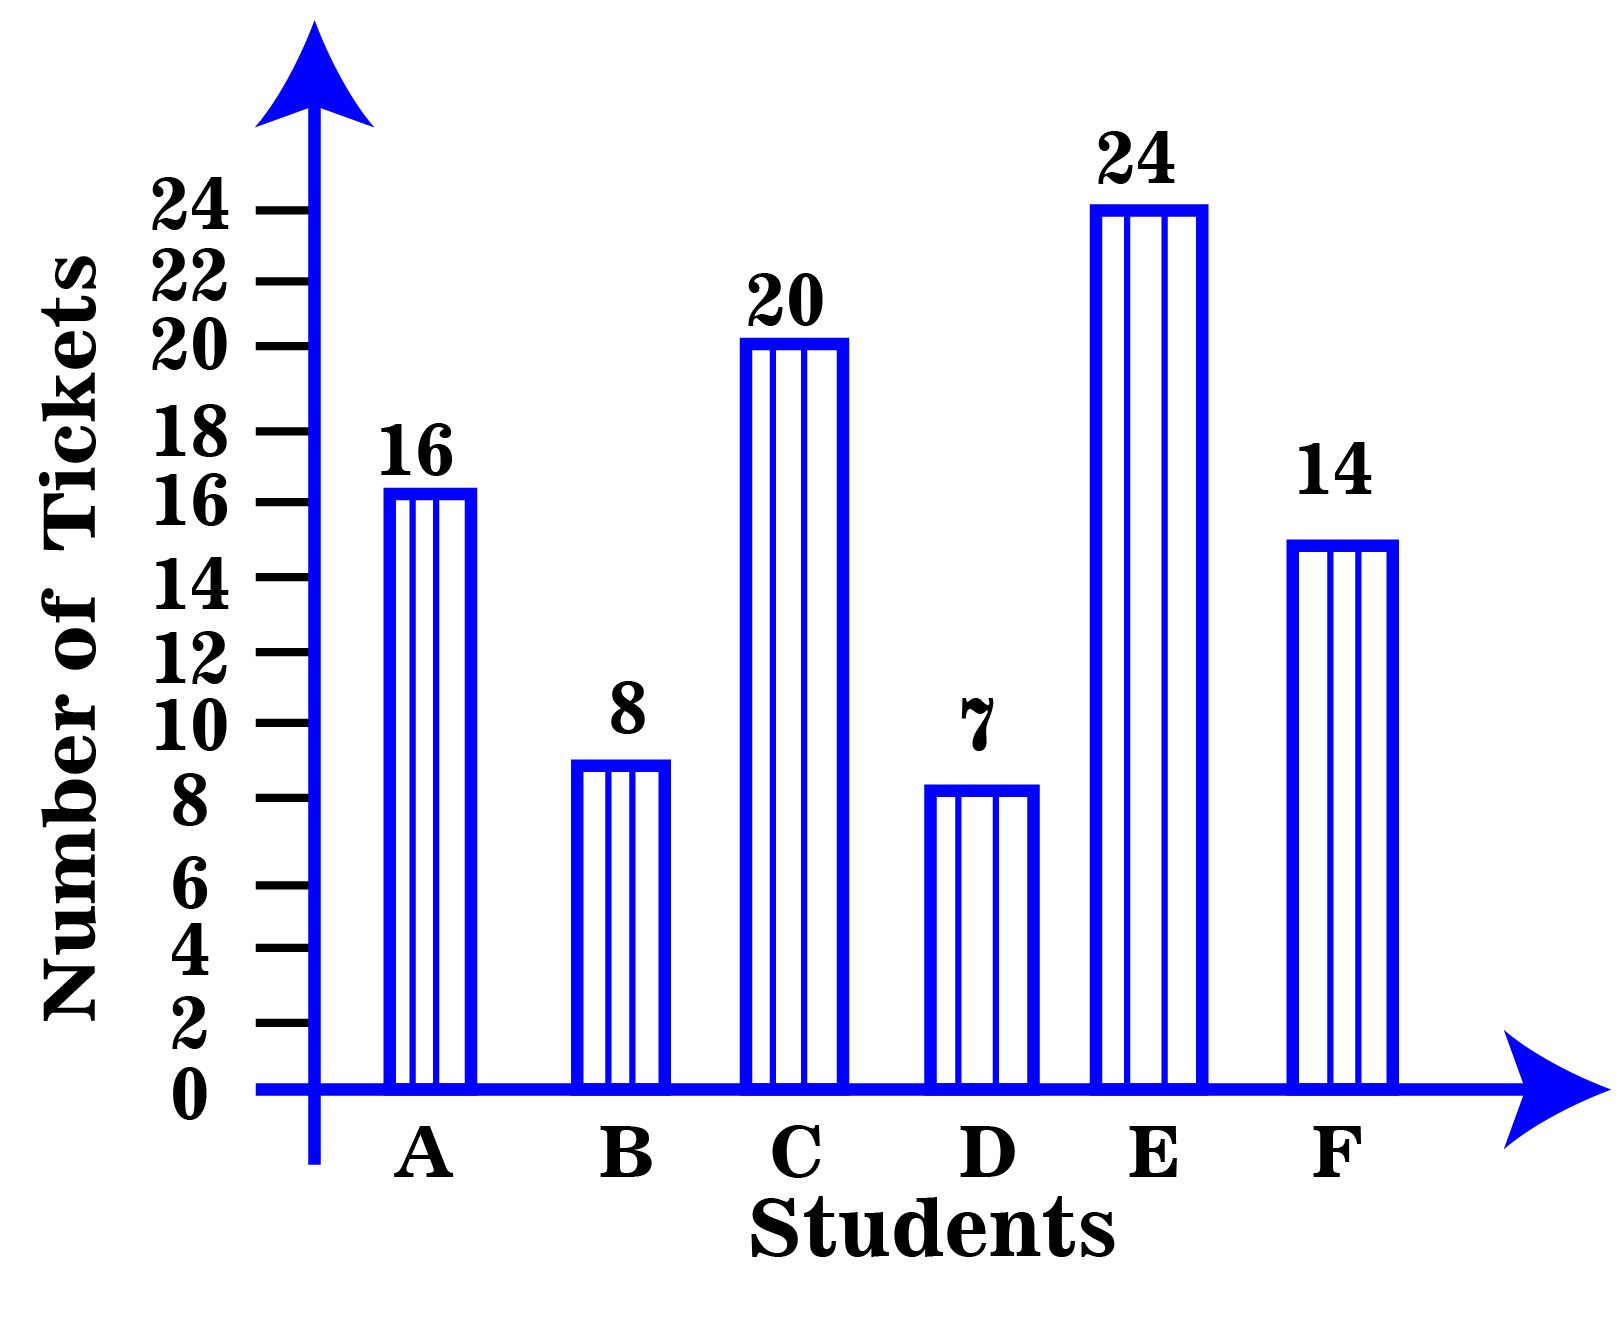
Which student sold the least tickets?
1307 05ea8144c14fb314c31fe88be
5ea8144c14fb314c31fe88be- 1Bfalse
- 2Ffalse
- 3Afalse
- 4Dtrue
- 5None of thesefalse
- Show AnswerHide Answer
- Workspace
- SingleChoice
Answer : 4. "D"
Q:Directions: The bar graph, given here, shows the number of tickets sold by 6 students A, B, C, D, E and F during a fair.
Total number of tickets sold by D, E and F is
1413 05ea814b7a63dac4c26cbdb4b
5ea814b7a63dac4c26cbdb4b- 147false
- 246false
- 345true
- 444false
- 5None of thesefalse
- Show AnswerHide Answer
- Workspace
- SingleChoice
Answer : 3. "45"
Q:Direction: Study the following graph and answer the questions based on it.
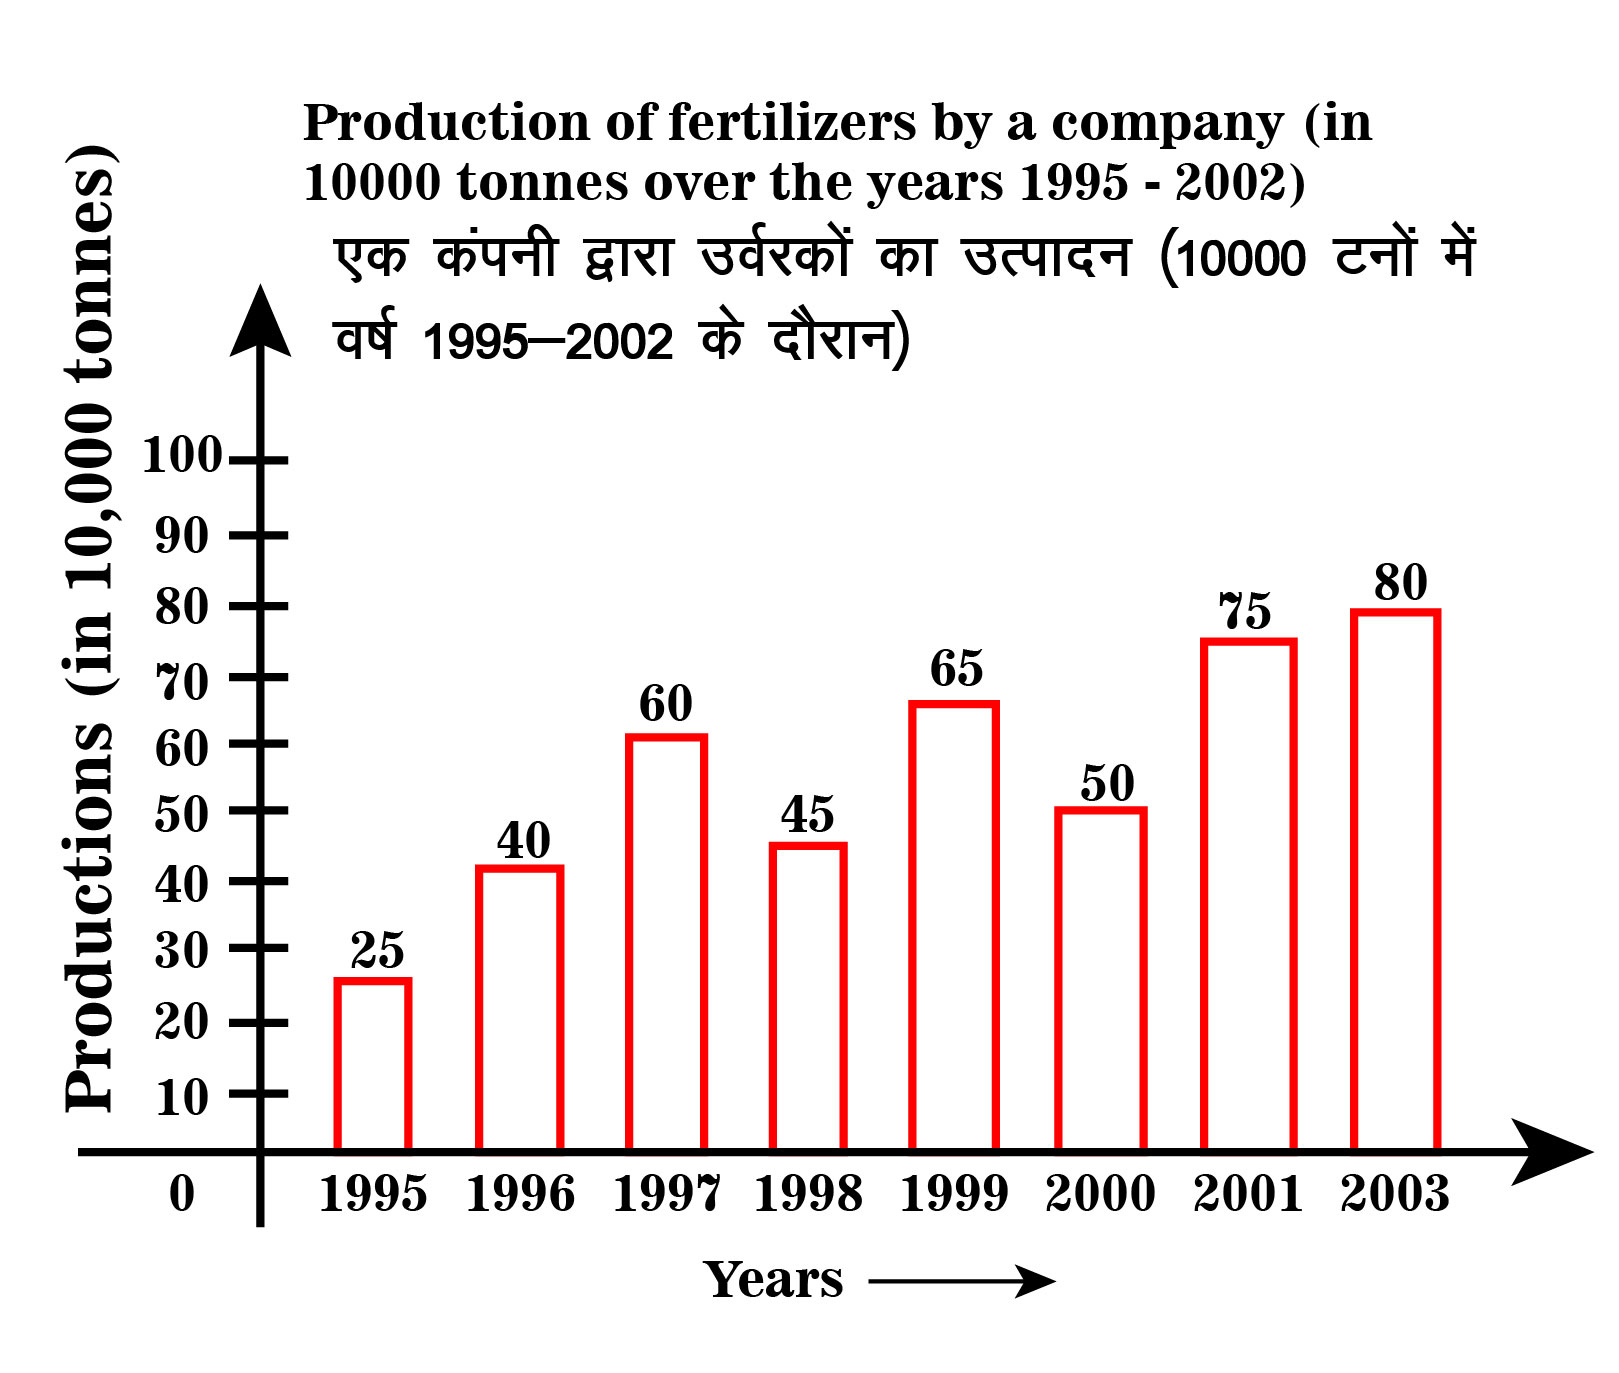
What was the percentage decline in the production of fertilizers from 1997 to 1998?
1334 05ea815c214fb314c31fe8e1e
5ea815c214fb314c31fe8e1e- 133%false
- 230%false
- 325%true
- 420%false
- 5None of thesefalse
- Show AnswerHide Answer
- Workspace
- SingleChoice
Answer : 3. "25%"
Q:Directions: The Bar Graph given here shows the population (in crores) of India in various census years. Observe the graph and answer the question based on it.
The percent increase in population from 1971 to 1981 is
2074 05ea80f5a14fb314c31fe1183
5ea80f5a14fb314c31fe1183- 124.8%true
- 220%false
- 316.7%false
- 422.9 %false
- 5None of thesefalse
- Show AnswerHide Answer
- Workspace
- SingleChoice
Answer : 1. "24.8% "
Q:Direction: Study the following graph and answer the questions based on it.
The ratio of total production of fertilizers in the year 1996 and 1997 to that of total production in the year 1995, 1998 and 2000 is
1445 05ea817103b50714be9b2441f
5ea817103b50714be9b2441f- 15 : 6true
- 26 : 5false
- 320 : 29false
- 413: 24false
- 5None of thesefalse
- Show AnswerHide Answer
- Workspace
- SingleChoice
Answer : 1. "5 : 6"
Q:Direction: Study the following graph and answer the questions based on it.
In which year was the percentage increase in production as compared to the previous year, the maximum?
1521 05ea816c4c8dec64c0097e00b
5ea816c4c8dec64c0097e00b- 12002false
- 22001false
- 31996true
- 41997false
- 5None of thesefalse
- Show AnswerHide Answer
- Workspace
- SingleChoice
Answer : 3. "1996"
Q:Direction: Study the following graph and answer the questions based on it.
In how many years was the production of fertilizers more than the average production of the given years?
1398 05ea8165e3b50714be9b23ed4
5ea8165e3b50714be9b23ed4- 11false
- 22false
- 33false
- 44true
- 5None of thesefalse
- Show AnswerHide Answer
- Workspace
- SingleChoice