


Data Interpretation Practice Question and Answer
8 Q:The table given below shows the information about bats manufactured by 6 different companies. Each company manufactures only plastic and wooden bats. Each company labels these bats as Brand A or Brand B. The table shows the number of plastic bats as a percentage of total bats manufactured by each company. It also shows the ratio of wooden bats labelled A and B. Each company manufactured a total 550000 bats.

N= wooden bats of brand B manufactured by U.
M= Total wooden bats manufactured by R and W together.
What is the value of N/M?
1314 05f30d792bcbb69394d1c9def
5f30d792bcbb69394d1c9defM= Total wooden bats manufactured by R and W together.
What is the value of N/M?
- 10.043false
- 20.061true
- 30.125false
- 40.087false
- Show AnswerHide Answer
- Workspace
- SingleChoice
Answer : 2. "0.061"
Q:Direction: Study the following line graph carefully and answer the questions given below.
In the below line graph, the number of animals in two zoo A and B in the years – 2001, 2003, 2005 and 2007 is given.
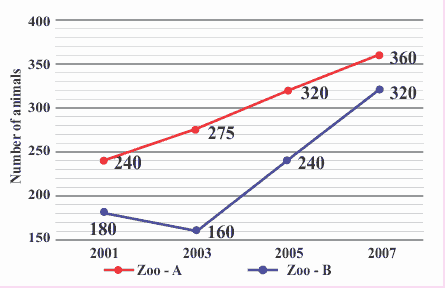
What is the ratio of the number of animals in zoo-A in the years 2001 and 2005 together and the number of animals in zoo-B in the years 2003 and 2007 together?
1313 064e5d9e2640c09b72f94cfb5
64e5d9e2640c09b72f94cfb5In the below line graph, the number of animals in two zoo A and B in the years – 2001, 2003, 2005 and 2007 is given.
- 17: 6true
- 26: 7false
- 35: 6false
- 47: 5false
- 5None of thesefalse
- Show AnswerHide Answer
- Workspace
- SingleChoice
Answer : 1. "7: 6"
Q:Directions : Study the following pie chart carefully and answer the questions. The pie chart represents the percentage of people involved in various occupations.
Total number of people = 20000
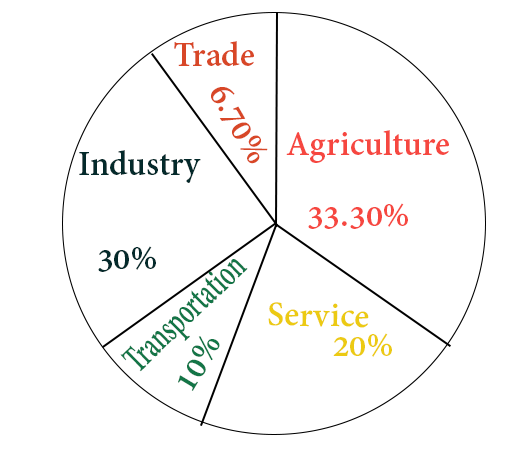
How many more people are involved in service than in trade?
1311 06453a41456b58a42369ad592
6453a41456b58a42369ad592Total number of people = 20000
- 13660false
- 22660true
- 31660false
- 4660false
- Show AnswerHide Answer
- Workspace
- SingleChoice
Answer : 2. "2660 "
Q:Directions: Study the Bar diagram carefully and answer the questions.
The Bar diagram shows the trends of foreign direct investment (FDI) into India from all over the World (in Rs. crores).
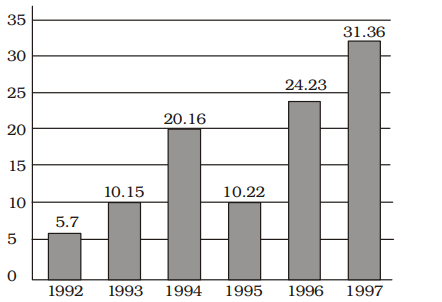
The absolute difference in FDI to India between 1996 and 1997 is
1311 063a56b4a8fc9692134068f38
63a56b4a8fc9692134068f38 - 1Rs. 7.29 croresfalse
- 2Rs. 7.13 crorestrue
- 3Rs. 7.16 croresfalse
- 4Rs. 7.22 croresfalse
- Show AnswerHide Answer
- Workspace
- SingleChoice
Answer : 2. "Rs. 7.13 crores "
Q:Direction: The following table shows the number of students of 7 colleges A, B, C, D, E, F, G participating in extra-curricular activities :
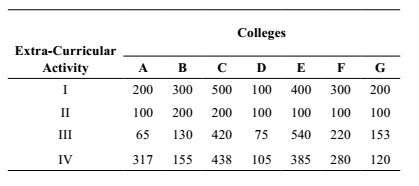
The college in which minimum number of students participate in extracurricular activities is ?
1304 06011472caf82aa3010a2f6a7
6011472caf82aa3010a2f6a7- 1Dtrue
- 2Gfalse
- 3Ffalse
- 4Afalse
- Show AnswerHide Answer
- Workspace
- SingleChoice
Answer : 1. "D "
Q: The following pie chart shows the number of bags sold by 7 different shops during a month as percentages of the total number of bags sold during this month by these 7 shops taken together.

If the total number of bags sold during the given month by these 7 shops taken together was 1400, then what was the total number of bags sold by S3 and S 7 taken together?
1301 0642ac3aded76c064b863b95b
642ac3aded76c064b863b95b- 1240false
- 2196false
- 3224true
- 4210false
- Show AnswerHide Answer
- Workspace
- SingleChoice
Answer : 3. "224 "
Q:Directions : In an Institution there are 800 students. Students use different modes of transport for going to the institution and return. The given pie diagram represents the requisite data. Study the diagram carefully and answer the questions.

The number of students who do not use institute bus is
1301 063ac3322e541fa7a013045e0
63ac3322e541fa7a013045e0- 1330false
- 2350false
- 3480false
- 4320true
- Show AnswerHide Answer
- Workspace
- SingleChoice
Answer : 4. "320 "
Q:Directions: Read the pie chart carefully and answer the following questions.
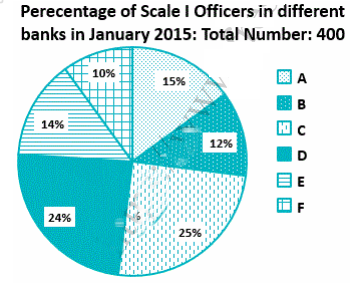
Note: No new employees joined the given banks of left the given banks from January 2015 to December 2015.
In December 2014, 4% of the candidates who applied for a job as Scale 1 officer were recruited in Bank A. If Bank A had 44 Scale 1 officers in 2014, what was the number of candidates who applied for the job?
1295 064f1dfadd928d8b716306f4d
64f1dfadd928d8b716306f4d- 1240false
- 2450false
- 3400true
- 4250false
- 5300false
- Show AnswerHide Answer
- Workspace
- SingleChoice