Data Interpretation Practice Question and Answer
8 Q:Study the following graph to answer these questions :
Percent profit earned by two companies A & B over the years.
Profit = Income – Expenditure
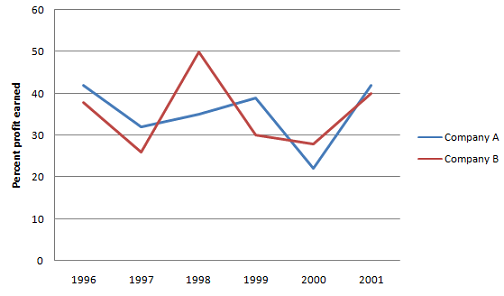
If the expenditure of Company A in 1997 was Rs.70 lakhs and income of Company A in 1997 was equal to its expenditure in 1998, what was the total income (in Rs. lakh) of the Company A in 1997 & 1998 together?
2813 05e79ab3f8560ba13b0276082
5e79ab3f8560ba13b0276082Percent profit earned by two companies A & B over the years.
Profit = Income – Expenditure
- 1175false
- 2131.25false
- 3218.75true
- 4Cannot be determinedfalse
- 5None of thesefalse
- Show AnswerHide Answer
- Workspace
- SingleChoice
Answer : 3. "218.75"
Q:Study the following graph to answer these questions :
Percent profit earned by two companies A & B over the years.
Profit = Income – Expenditure
Expenditure of Company B in 1999 was 90% of its expenditure in 1998. Income of Company B in 1999 was what percent of its income in 1998?
3491 05e79aaa54572817353d62577
5e79aaa54572817353d62577Percent profit earned by two companies A & B over the years.
Profit = Income – Expenditure
- 1130.5false
- 2$$ {96 {2\over3}}$$false
- 3121.5false
- 4$$ {99 {1\over3}}$$true
- 5None of thesefalse
- Show AnswerHide Answer
- Workspace
- SingleChoice
Answer : 4. "$$ {99 {1\over3}}$$"
Q:Study the following graph to answer these questions :
Percent profit earned by two companies A & B over the years.
Profit = Income – Expenditure
If the income of Company A in 1998 was Rs. 1,42,500 what was its expenditure in that year?
2701 05e79aa214572817353d624e6
5e79aa214572817353d624e6Percent profit earned by two companies A & B over the years.
Profit = Income – Expenditure
- 1RS. 1,05,000false
- 2RS. 95,500false
- 3RS. 99,500false
- 4RS. 1,05,555false
- 5None of thesetrue
- Show AnswerHide Answer
- Workspace
- SingleChoice
Answer : 5. "None of these "
Q:The following line graph gives the percentage of the number of candidates who qualified an examination out of the total number of candidates who appeared for the examination over a period of seven years from 1994 to 2000.
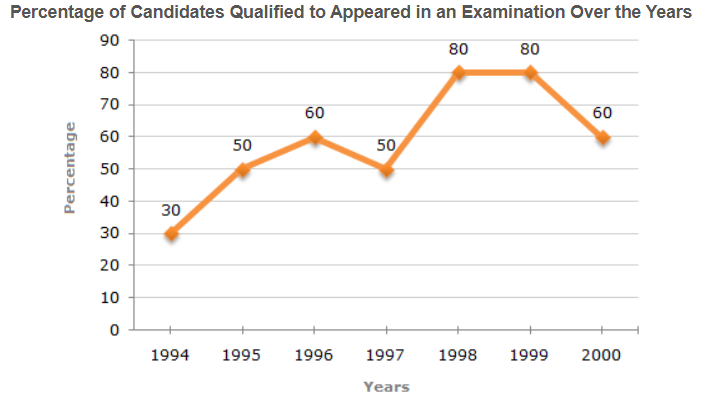
The total number of candidates qualified in 1999 and 2000 together was 33500 and the number of candidates appeared in 1999 was 26500. What was the number of candidates in 2000?
2512 05e799cbc8560ba13b02739f0
5e799cbc8560ba13b02739f0- 124500false
- 222000false
- 320500true
- 419000false
- 5None of thesefalse
- Show AnswerHide Answer
- Workspace
- SingleChoice
Answer : 3. "20500"
Q:The following line graph gives the percentage of the number of candidates who qualified an examination out of the total number of candidates who appeared for the examination over a period of seven years from 1994 to 2000.
If the total number of candidates appeared in 1996 and 1997 together was 47400, then the total number of candidates qualified in these two years together was?
2555 05e799c4350339c736663124c
5e799c4350339c736663124c- 134700false
- 232100false
- 331500false
- 4Data inadequatetrue
- 5None of thesefalse
- Show AnswerHide Answer
- Workspace
- SingleChoice
Answer : 4. "Data inadequate"
Q:The following line graph gives the percentage of the number of candidates who qualified an examination out of the total number of candidates who appeared for the examination over a period of seven years from 1994 to 2000.
If the number of candidates qualified in 1998 was 21200, what was the number of candidates appeared in 1998?
2028 05e799a058560ba13b0273678
5e799a058560ba13b0273678- 132000false
- 228500false
- 326500true
- 425000false
- 5None of thesefalse
- Show AnswerHide Answer
- Workspace
- SingleChoice
Answer : 3. "26500"
Q:The following line graph gives the percentage of the number of candidates who qualified an examination out of the total number of candidates who appeared for the examination over a period of seven years from 1994 to 2000.
In which pair of years was the number of candidates qualified, the same?
2068 05e799982c59e560304b98b59
5e799982c59e560304b98b59- 11995 and 1997false
- 21995 and 2000false
- 31998 and 1999false
- 4Data inadequatetrue
- 5None of thesefalse
- Show AnswerHide Answer
- Workspace
- SingleChoice
Answer : 4. "Data inadequate"
Q:The following line graph gives the percentage of the number of candidates who qualified an examination out of the total number of candidates who appeared for the examination over a period of seven years from 1994 to 2000.
The difference between the percentage of candidates qualified to appeared was maximum in which of the following pairs of years?
2070 05e7998fd8560ba13b02734cd
5e7998fd8560ba13b02734cd- 11994 and 1995false
- 21997 and 1998true
- 31998 and 1999false
- 41999 and 2000false
- 5None of thesefalse
- Show AnswerHide Answer
- Workspace
- SingleChoice