Data Interpretation Practice Question and Answer
8 Q:The pie graph given here shows the break-up of the cost of construction of a house.
Assuming that the total cost of construction is ₹ 6,00,000, answer the questions.
Break-up of the cost of construction of a house
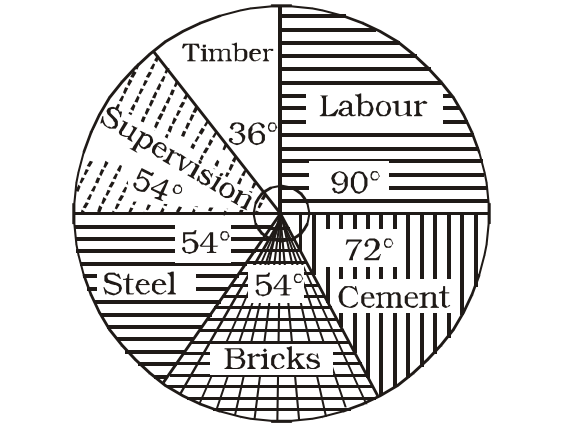
The amount spent on cement is
955 06332ddf25c208a6bf707b81a
6332ddf25c208a6bf707b81a- 1₹ 2,00,000false
- 2₹ 1,60,000false
- 3₹ 1,20,000true
- 4₹ 1,00,000false
- Show AnswerHide Answer
- Workspace
- SingleChoice
Answer : 3. "₹ 1,20,000 "
Q:Directions: Read the pie chart carefully and answer the following questions.
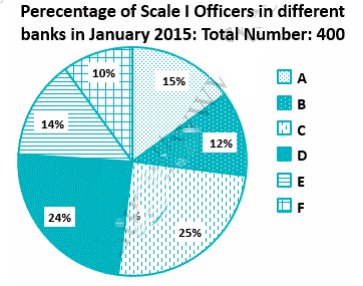
Note: No new employees joined the given banks of left the given banks from January 2015 to December 2015.
In December 2014, 4% of the candidates who applied for a job as Scale 1 officer were recruited in Bank A. If Bank A had 44 Scale 1 officers in 2014, what was the number of candidates who applied for the job?
952 064f1dfadd928d8b716306f4d
64f1dfadd928d8b716306f4d- 1240false
- 2450false
- 3400true
- 4250false
- 5300false
- Show AnswerHide Answer
- Workspace
- SingleChoice
Answer : 3. "400"
Q:Direction: Study the following line graph carefully and answer the questions given below.
In the below line graph, the number of animals in two zoo A and B in the years – 2001, 2003, 2005 and 2007 is given.
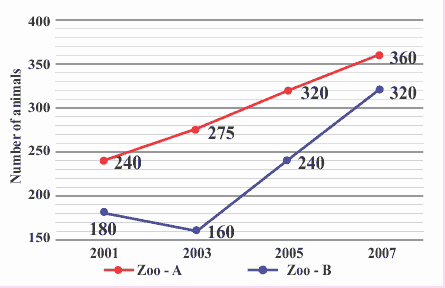
What is the sum of the differences of the number of animals in zoo-A and zoo-B in the years 2001, 2003 and 2005?
952 064e5dac2d928d8b7160df487
64e5dac2d928d8b7160df487In the below line graph, the number of animals in two zoo A and B in the years – 2001, 2003, 2005 and 2007 is given.
- 1185false
- 2235false
- 3255true
- 4275false
- 5None of thesefalse
- Show AnswerHide Answer
- Workspace
- SingleChoice
Answer : 3. "255"
Q: The bar chart given below shows the number of tea packets of 2 varieties sold by 5 shops during a particular week.

What is the average number of tea packets sold per shop, both the varieties take together?
948 0642ac307dcb650c14576f3db
642ac307dcb650c14576f3db- 1154.4true
- 2152.8false
- 3157.6false
- 4149.2false
- Show AnswerHide Answer
- Workspace
- SingleChoice
Answer : 1. "154.4 "
Q:The pie graph given here shows the break-up of the cost of construction of a house.
Assuming that the total cost of construction is ₹ 6,00,000, answer the questions.
Break-up of the cost of construction of a house
The amount spent on labour exceeds the amount spent on supervision by
947 06332dfff31300b7ce4904f7c
6332dfff31300b7ce4904f7c- 1₹ 2,00,000false
- 2₹ 1,60,000false
- 3₹ 1,20,000false
- 4₹ 60,000true
- Show AnswerHide Answer
- Workspace
- SingleChoice
Answer : 4. "₹ 60,000"
Q:Directions : The pie graph indicates the break-up of the cost of construction of a house. Assuming that the total cost of construction is Rs 6,00,000, answer the following questions.
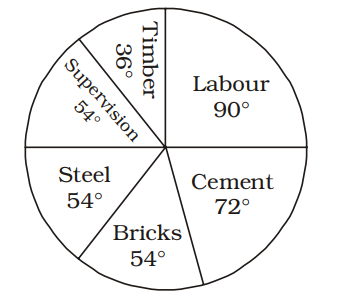
The amount spent on labour exceeds the amount spent on steel by :
946 063aac3d05770eb565d511af9
63aac3d05770eb565d511af9
- 110% of the total costtrue
- 211% of the total costfalse
- 313% of the total costfalse
- 49% of the total costfalse
- Show AnswerHide Answer
- Workspace
- SingleChoice
Answer : 1. "10% of the total cost "
Q: The following table shows the number of bundles of iron bars of 5 different brands sold from a shop during a given week.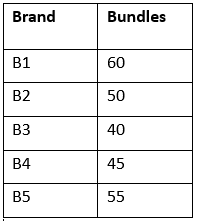
The number of iron bars in each bundle of B1 and B3 is 5. The number of iron bars in each bundle of B2, B4 and B5 is 4. What is the total number of iron bars sold from the shop during that week of all the 5 brands taken together?
945 0643d11de2d621da11696c4c9
643d11de2d621da11696c4c9- 11100true
- 21200false
- 31150false
- 41250false
- Show AnswerHide Answer
- Workspace
- SingleChoice
Answer : 1. "1100"
Q:Direction: Read the following table carefully and answer the following questions:
Table shows the percentage of male and female employees in different education in a company and total number of males and females:
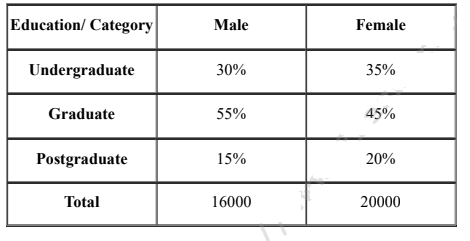
Find the average number of Undergraduate employees in a company.
942 064e750afde1aa1b70fdee97c
64e750afde1aa1b70fdee97c- 16300false
- 26100false
- 35400false
- 45900true
- 56700false
- Show AnswerHide Answer
- Workspace
- SingleChoice