Data Interpretation Practice Question and Answer
8 Q:Direction: Percentage of different types of employees in a company in two consecutive years.
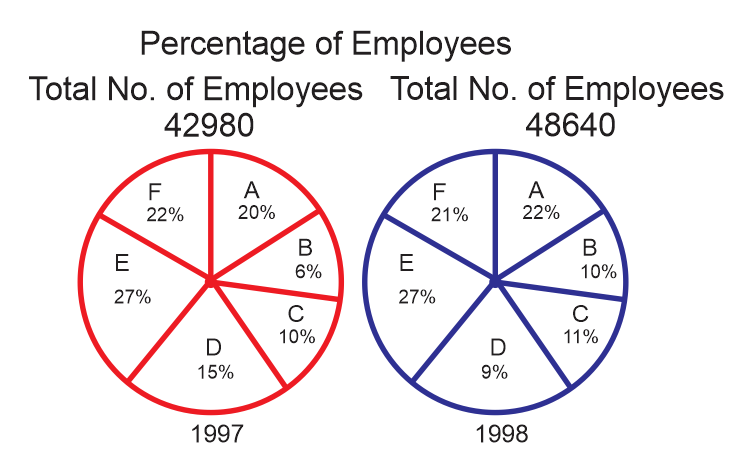
The number of A type employees in 1998 was approximately what percent of the number of A type employees in 1997?
2209 05e32782428cc9f70127707c2
5e32782428cc9f70127707c2- 1125false
- 295false
- 3115true
- 4140false
- Show AnswerHide Answer
- Workspace
- SingleChoice
Answer : 3. "115 "
Q:Direction: Percentage of different types of employees in a company in two consecutive years.
If the number of D type employees in 1998 was 5000. What would have been its approximate percentage in the company?
2095 05e32774fd0aa6f23a8fc64e6
5e32774fd0aa6f23a8fc64e6- 114false
- 210true
- 312false
- 416false
- Show AnswerHide Answer
- Workspace
- SingleChoice
Answer : 2. "10 "
Q:Direction: Percentage of different types of employees in a company in two consecutive years.
What was the approximate difference in the number of B type of employees during 1997 and 1998?
1605 05e3275f928cc9f701276fa95
5e3275f928cc9f701276fa95- 12620false
- 22085false
- 32285true
- 42325false
- Show AnswerHide Answer
- Workspace
- SingleChoice
Answer : 3. "2285"
Q:Direction: Percentage of different types of employees in a company in two consecutive years.
From 1997 to 1998 in the case of which of the following types of employees the change was maximum ?
1398 05e3274b41f7362736228359d
5e3274b41f7362736228359d- 1Cfalse
- 2Dfalse
- 3Btrue
- 4Afalse
- Show AnswerHide Answer
- Workspace
- SingleChoice
Answer : 3. "B"
Q:Direction: Percentage of different types of employees in a company in two consecutive years.
In 1997 the total number of which of the following types of pairs of employees was approximately equal to the employees in 1998?
1533 05e3274271f73627362283556
5e3274271f73627362283556- 1D and Efalse
- 2C and Dtrue
- 3A and Cfalse
- 4B and Cfalse
- Show AnswerHide Answer
- Workspace
- SingleChoice
Answer : 2. "C and D "
Q:A bar graph shows unit production and unit sold of the different type of mobile company A, B, C, D E and F. Study the bar graph and give the answer of following questions.
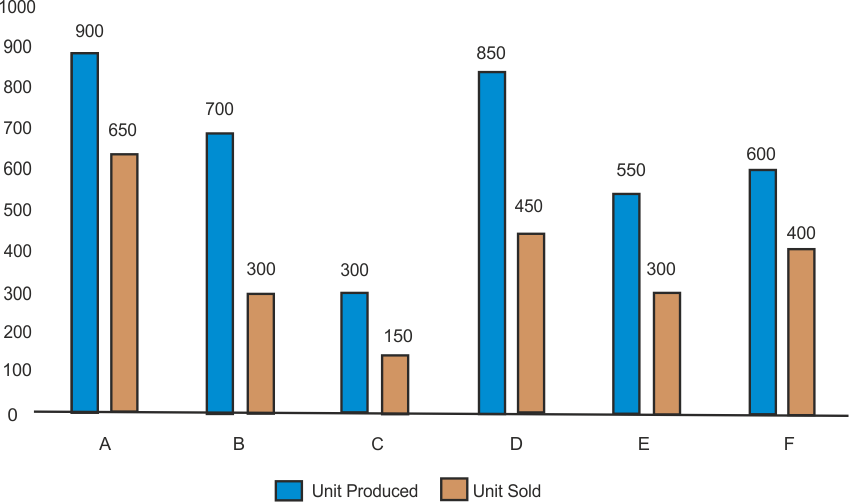
Which mobile company have the maximum difference between the unit produced and unit sold.
1334 05e213d20ac282f4217111c06
5e213d20ac282f4217111c06- 1A, Bfalse
- 2B, Afalse
- 3C, Dfalse
- 4B, Dtrue
- Show AnswerHide Answer
- Workspace
- SingleChoice
Answer : 4. "B, D"
Q:A bar graph shows unit production and unit sold of the different type of mobile company A, B, C, D E and F. Study the bar graph and give the answer of following questions.
What is the difference between unit produced and unit sold of Mobile C Company?
1293 05e213c7d5f8f8e395f9076f7
5e213c7d5f8f8e395f9076f7- 1150true
- 2300false
- 3650false
- 4120false
- Show AnswerHide Answer
- Workspace
- SingleChoice
Answer : 1. "150"
Q:Direction: Study the following graph carefully and answer the questions that follow:
The graph given below represents the number of users of two broadband services A and B across 5 cities P, Q, R, S and T.
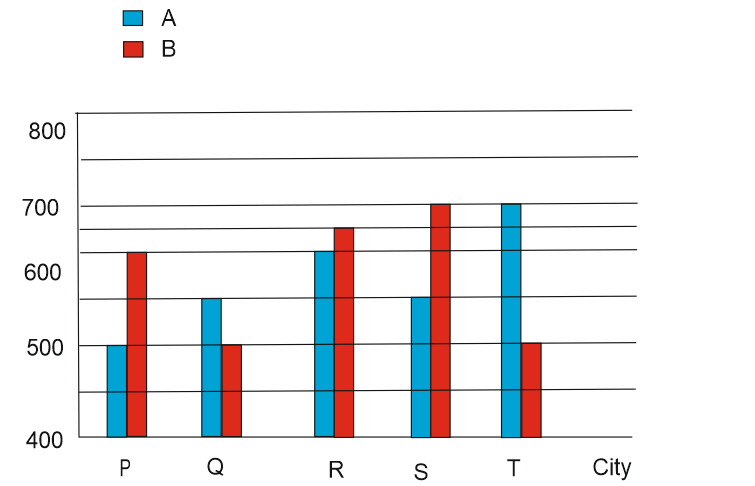
What is the respective ratio of the number of users of brand A in city P to the number of users of brand B in the City S?
1857 05df0be0ee837331209ea1ec0
5df0be0ee837331209ea1ec0The graph given below represents the number of users of two broadband services A and B across 5 cities P, Q, R, S and T.
- 15:7true
- 24:7false
- 32:5false
- 43:4false
- 55:6false
- Show AnswerHide Answer
- Workspace
- SingleChoice