Data Interpretation Practice Question and Answer
8 Q:Directions: The table given here shows the production of five types of cars by a company in the year 1989 to 1994. Study the table and answer questions.
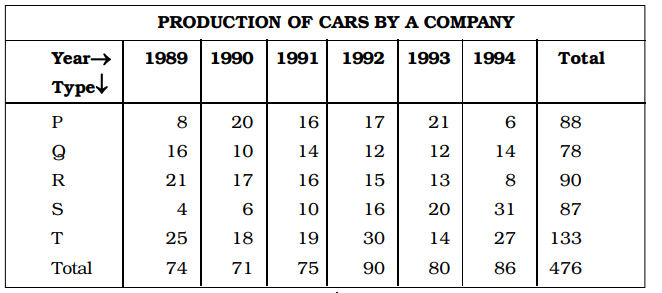
In which year the total production of cars of types P and Q together was equal to the total production of cars of types R and S together?
908 0632db25031300b7ce47a86f9
632db25031300b7ce47a86f9- 11990false
- 21991false
- 31994false
- 4None of the abovetrue
- Show AnswerHide Answer
- Workspace
- SingleChoice
Answer : 4. "None of the above"
Q:Directions : In an Institution there are 800 students. Students use different modes of transport for going to the institution and return. The given pie diagram represents the requisite data. Study the diagram carefully and answer the questions.

If the total amount spent by the Government during the year was ₹ 3,00,000 crores, the amount spent on state development exceeds that on sports by
905 063ac34874edf0d569930f73f
63ac34874edf0d569930f73f- 1₹ 30,000 croretrue
- 2₹ 45,000 crorefalse
- 3₹ 35,000 crorefalse
- 4₹ 25,000 crorefalse
- Show AnswerHide Answer
- Workspace
- SingleChoice
Answer : 1. "₹ 30,000 crore "
Q:Directions: The bar diagram given below shows the productions (in the unit of thousand pieces) of three types of biscuits by a company in the five consecutive years. Study the diagram and answer the following questions.
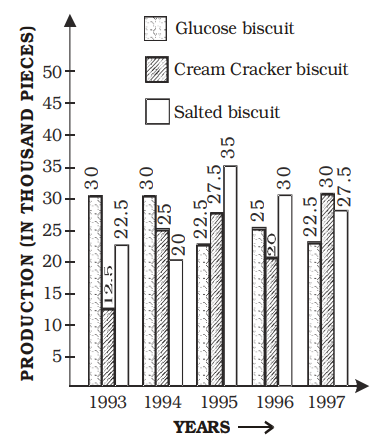
The production of all the three types of biscuits was maximum in the year
902 06489aea5f4063d472f4ae608
6489aea5f4063d472f4ae608- 11995true
- 21994false
- 31996false
- 41993false
- Show AnswerHide Answer
- Workspace
- SingleChoice
Answer : 1. "1995 "
Q:Directions : The Bar Graph given here shows the population (in crores) of India in various census years. Observe the graph and answer the question based on it.
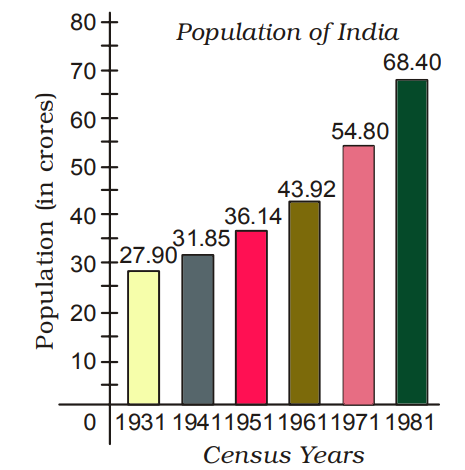
In which census year, the per cent increase in population is least as compared to that in the previous census year?
900 06453a9d1f3618908bf5e24c1
6453a9d1f3618908bf5e24c1- 11961false
- 21951true
- 31971false
- 41941false
- Show AnswerHide Answer
- Workspace
- SingleChoice
Answer : 2. "1951 "
Q:Directions: Degree- wise breakup of employees working in various department of an organisation and the ratio to men to women.
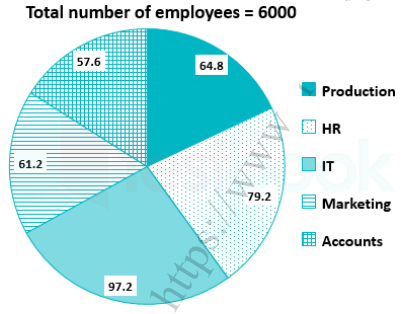
Respective ratio of men to women in each department
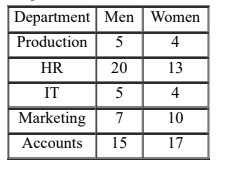
What is the number of men working in the marketing department?
899 064da02a3ebd5c374728ab0d7
64da02a3ebd5c374728ab0d7- 1240false
- 2360false
- 3420true
- 4720false
- 5500false
- Show AnswerHide Answer
- Workspace
- SingleChoice
Answer : 3. "420"
Q: The adjoining diagram is frequency polygon for the scores of students in a test.
What is the total number of students appeared in the test?
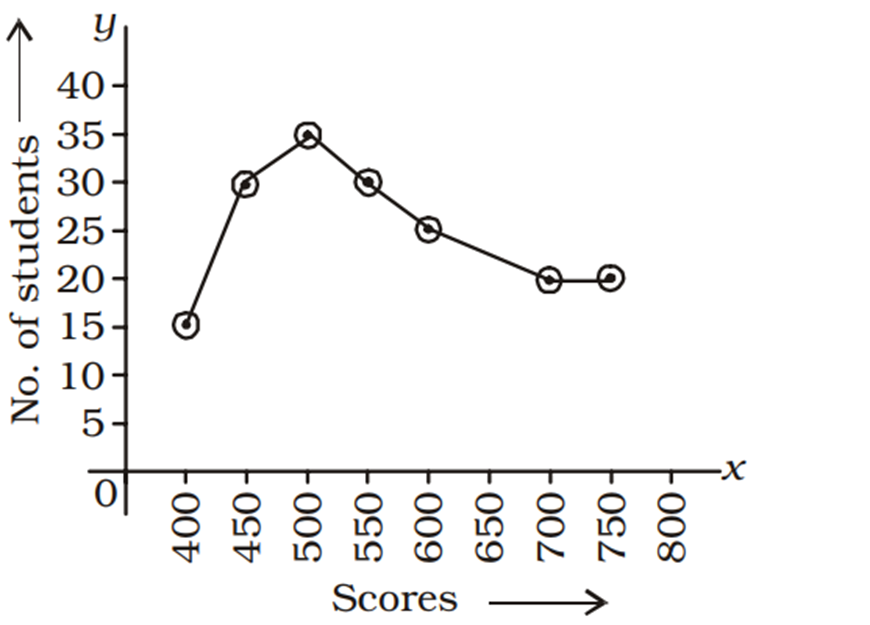
899 063ee1c6a7312b71d33e2f206
63ee1c6a7312b71d33e2f206What is the total number of students appeared in the test?
- 1180true
- 2200false
- 3250false
- 4150false
- Show AnswerHide Answer
- Workspace
- SingleChoice
Answer : 1. "180 "
Q:Direction: Study the following line graph carefully and answer the questions given below.
In the below line graph, the number of animals in two zoo A and B in the years – 2001, 2003, 2005 and 2007 is given.
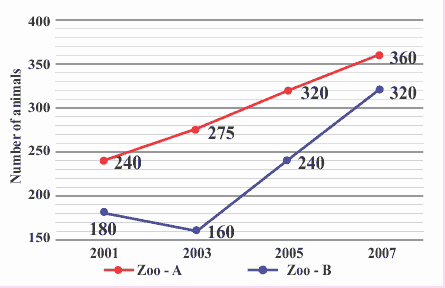
If in the year 2005, 35% of animals in zoo-A and 55% of animals in zoo-B are carnivorous, then what is the sum of the number of carnivorous animals in zoo A and B in the years 2005?
899 064e5db5fd928d8b7160df4b6
64e5db5fd928d8b7160df4b6In the below line graph, the number of animals in two zoo A and B in the years – 2001, 2003, 2005 and 2007 is given.
- 1184false
- 2196false
- 3222false
- 4244true
- 5None of thesefalse
- Show AnswerHide Answer
- Workspace
- SingleChoice
Answer : 4. "244"
Q:Directions: Degree- wise breakup of employees working in various department of an organisation and the ratio to men to women.
Respective ratio of men to women in each department
What is the total number of women working in the organisation?
891 064da0531e0ce5574969ef19a
64da0531e0ce5574969ef19a- 12450false
- 22830true
- 32520false
- 42480false
- 53320false
- Show AnswerHide Answer
- Workspace
- SingleChoice