Data Interpretation Practice Question and Answer
8 Q:Direction: Study the following graph carefully and answer the questions that follow:
The graph given below represents the number of users of two broadband services A and B across 5 cities P, Q, R, S and T.
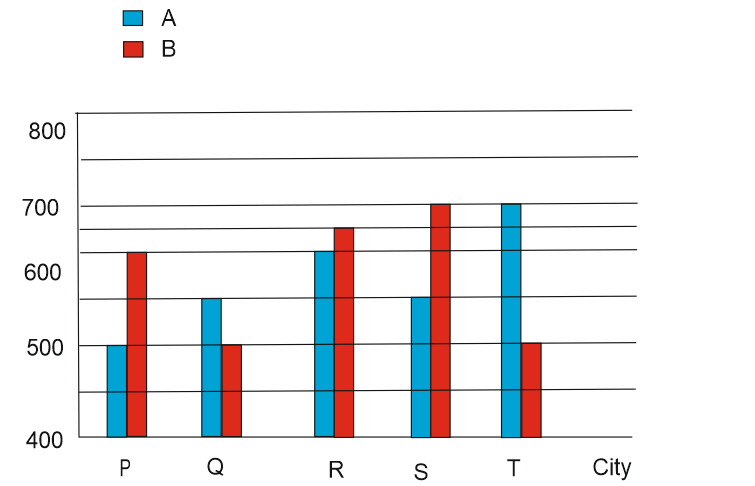
What is the difference between the total number of users of brand A and B together in City R and the total number of users of brand A and B together in City P?
1665 05df0bda2e837331209ea1b4f
5df0bda2e837331209ea1b4fThe graph given below represents the number of users of two broadband services A and B across 5 cities P, Q, R, S and T.
- 1170false
- 2140false
- 3130false
- 4150true
- 5160false
- Show AnswerHide Answer
- Workspace
- SingleChoice
Answer : 4. "150"
Q:Direction: Study the following graph carefully and answer the questions that follow:
The graph given below represents the number of users of two broadband services A and B across 5 cities P, Q, R, S and T.
What is the average number of users of brand A across all five cities together?
1502 05df0bcc53d76f974e561f6f3
5df0bcc53d76f974e561f6f3The graph given below represents the number of users of two broadband services A and B across 5 cities P, Q, R, S and T.
- 1560false
- 2570false
- 3580true
- 4590false
- 5550false
- Show AnswerHide Answer
- Workspace
- SingleChoice
Answer : 3. "580"
Q:Direction: Study the following graph carefully and answer the questions that follow:
The graph given below represents the number of users of two broadband services A and B across 5 cities P, Q, R, S and T.
The number of users of brand A in city T is what percent of the number of users of brand B in city Q?
1539 05df0bc51e837331209ea1929
5df0bc51e837331209ea1929The graph given below represents the number of users of two broadband services A and B across 5 cities P, Q, R, S and T.
- 1150false
- 2110false
- 3140true
- 4160false
- 5120false
- Show AnswerHide Answer
- Workspace
- SingleChoice
Answer : 3. "140"
Q:Direction: Study the following graph carefully and answer the questions that follow:
The graph given below represents the number of users of two broadband services A and B across 5 cities P, Q, R, S and T.
What is the total number of users of brand B across all five cities together?
1543 05df0bb273d76f974e561f39e
5df0bb273d76f974e561f39eThe graph given below represents the number of users of two broadband services A and B across 5 cities P, Q, R, S and T.
- 12700false
- 23000true
- 33100false
- 42900false
- 53200false
- Show AnswerHide Answer
- Workspace
- SingleChoice
Answer : 2. "3000"
Q:Directions: The bar graph given below shows the spending of family income on various items and savings during 1993. Observe the graph and answer the following questions:
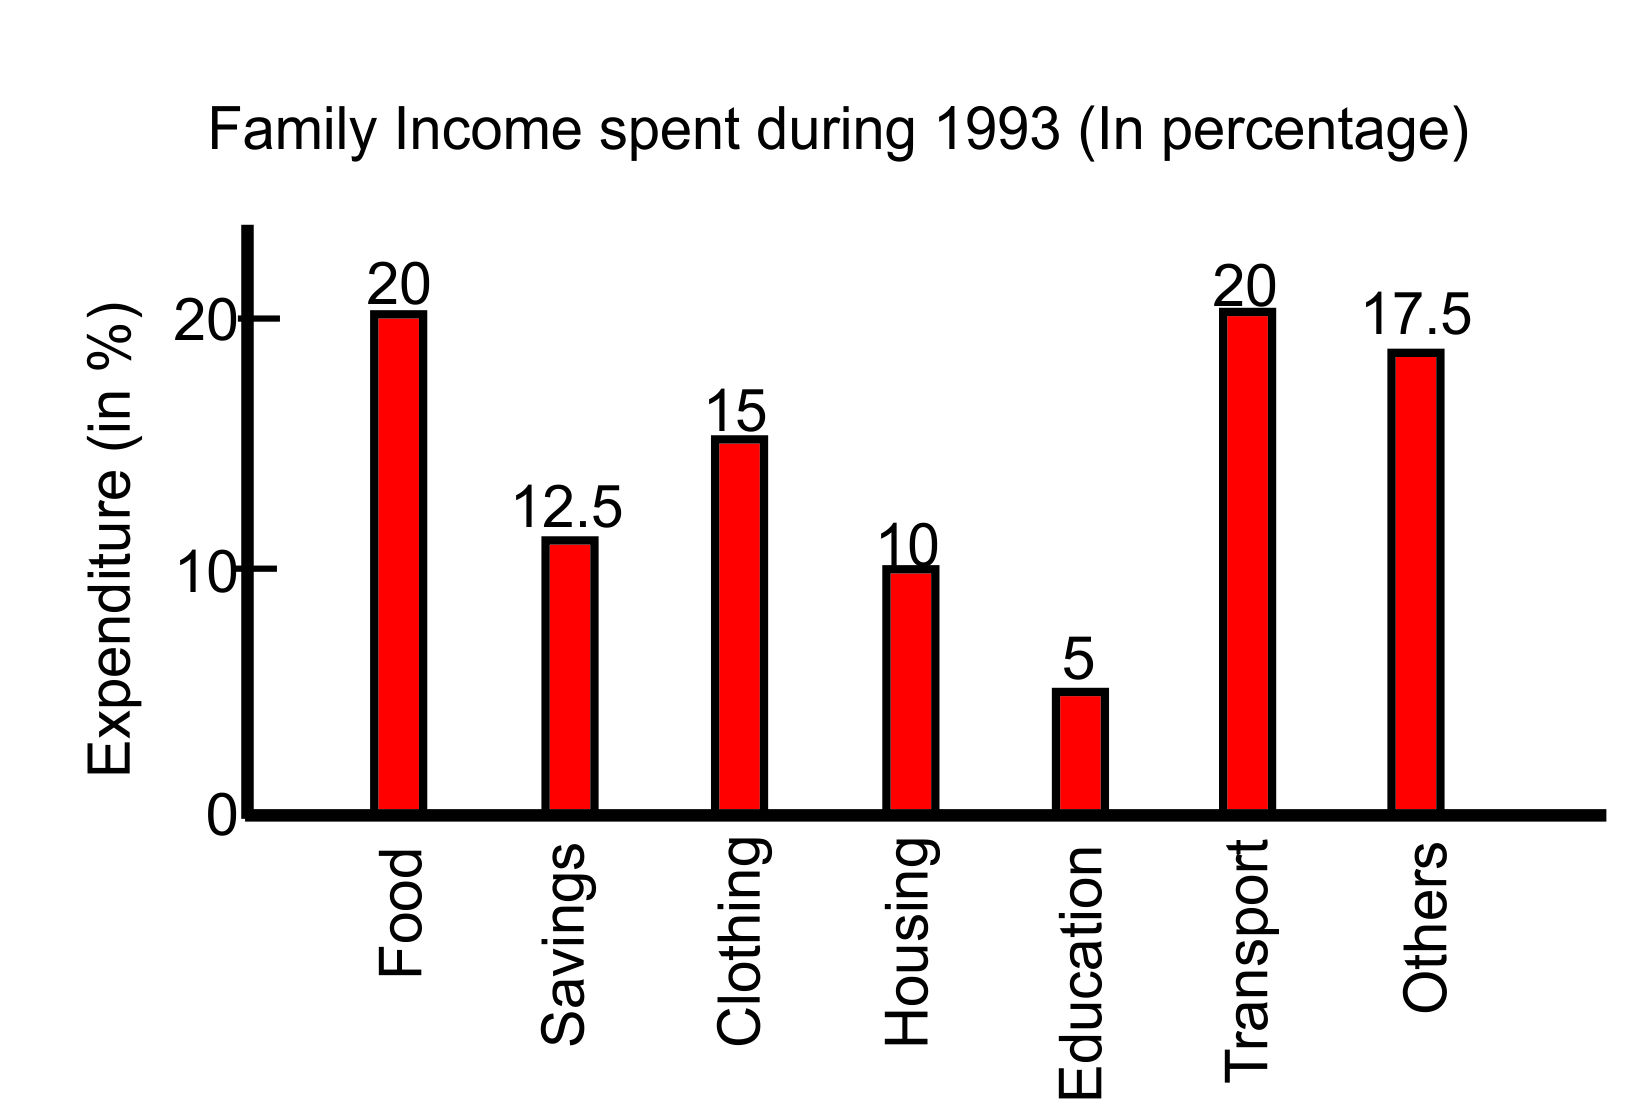
The savings of the family is more than that of expenditure incurred on:
2010 05def3f82806c5b05d54f26b3
5def3f82806c5b05d54f26b3- 1housingtrue
- 2clothingfalse
- 3transportfalse
- 4othersfalse
- Show AnswerHide Answer
- Workspace
- SingleChoice
Answer : 1. "housing "
Q:Directions: The bar graph given below shows the spending of family income on various items and savings during 1993. Observe the graph and answer the following questions:
The total expenses of the family on transport is equal to those spent on:
1391 05def3eea806c5b05d54f2644
5def3eea806c5b05d54f2644- 1savingsfalse
- 2clothingfalse
- 3foodtrue
- 4othersfalse
- Show AnswerHide Answer
- Workspace
- SingleChoice
Answer : 3. "food "
Q:Directions: The bar graph given below shows the spending of family income on various items and savings during 1993. Observe the graph and answer the following questions:
If the total income of the family during 1993 was ₹ 100000, the savings of the family in 1993 was:
1826 05def3e2d6d799a05c00a5ec8
5def3e2d6d799a05c00a5ec8- 1₹1,750false
- 2₹20,000false
- 3₹12,500true
- 4₹50,000false
- Show AnswerHide Answer
- Workspace
- SingleChoice
Answer : 3. "₹12,500 "
Q:Directions: The bar graph given below shows the spending of family income on various items and savings during 1993. Observe the graph and answer the following questions:
The percent of income spent on clothing exceeds that on savings by :
1573 05def3b986d799a05c00a472c
5def3b986d799a05c00a472c- 112.5 %false
- 22.5 %true
- 310%false
- 422.5 %false
- Show AnswerHide Answer
- Workspace
- SingleChoice