Data Interpretation Practice Question and Answer
8 Q:Directions: Degree- wise breakup of employees working in various department of an organisation and the ratio to men to women.
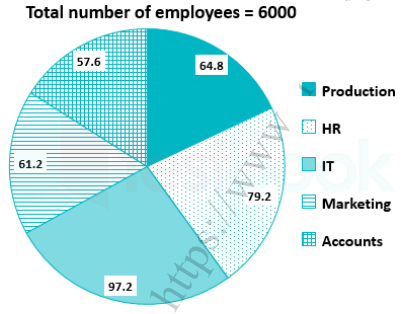
Respective ratio of men to women in each department
What is the total number of women working in the organisation?
891 064da0531e0ce5574969ef19a
64da0531e0ce5574969ef19a- 12450false
- 22830true
- 32520false
- 42480false
- 53320false
- Show AnswerHide Answer
- Workspace
- SingleChoice
Answer : 2. "2830"
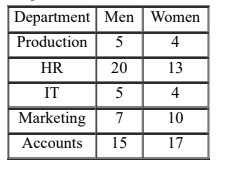
Q:Directions: Study the following information carefully and answer the questions given below.
In the table, the percentage of shirts (formal and casual) sold out of the total number of shirts sold in the week and the number of casual shirts sold data related to the number of shirts sold on ve weekdays – Monday, Tuesday, Wednesday, Thursday and Friday are given.
Total number of shirts sold in the week = x Note: Total number of shirts sold on Saturday and Sunday together = 72
What is the sum of the formal shirts sold on Monday, Tuesday and Wednesday together?
890 064e5edc9d928d8b7160e3c6a
64e5edc9d928d8b7160e3c6aIn the table, the percentage of shirts (formal and casual) sold out of the total number of shirts sold in the week and the number of casual shirts sold data related to the number of shirts sold on ve weekdays – Monday, Tuesday, Wednesday, Thursday and Friday are given.
Note: Total number of shirts sold on Saturday and Sunday together = 72- 1102false
- 2168false
- 384true
- 464false
- 5None of thesefalse
- Show AnswerHide Answer
- Workspace
- SingleChoice
Answer : 3. "84"
Q:Directions: The pie– chart shows the proposed outlay for different sectors during a Five–Year plan of Government of India. Total outlay is Rs. 40,000 crores. By reading the pie–chart answer the following three questions.
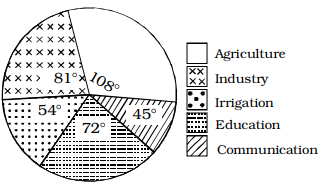
What is the proposed outlay for Education?
889 06489a3f7b90df94e034c7e06
6489a3f7b90df94e034c7e06- 1Rs. 6000 croresfalse
- 2Rs. 8000 crorestrue
- 3Rs. 9000 croresfalse
- 4Rs. 7000 croresfalse
- Show AnswerHide Answer
- Workspace
- SingleChoice
Answer : 2. "Rs. 8000 crores "
Q:Directions: Study the following information carefully and answer the questions given below.
In the table, the percentage of shirts (formal and casual) sold out of the total number of shirts sold in the week and the number of casual shirts sold data related to the number of shirts sold on ve weekdays – Monday, Tuesday, Wednesday, Thursday and Friday are given.
Total number of shirts sold in the week = x Note: Total number of shirts sold on Saturday and Sunday together = 72
What is the ratio of the number of casual shirts sold on Monday and Wednesday together and a number of formal shirts sold on Tuesday and Thursday together?
889 064e5ee61d928d8b7160e3e25
64e5ee61d928d8b7160e3e25In the table, the percentage of shirts (formal and casual) sold out of the total number of shirts sold in the week and the number of casual shirts sold data related to the number of shirts sold on ve weekdays – Monday, Tuesday, Wednesday, Thursday and Friday are given.
Note: Total number of shirts sold on Saturday and Sunday together = 72- 14 : 3false
- 23: 4false
- 35 : 3false
- 46: 5false
- 5None of thesetrue
- Show AnswerHide Answer
- Workspace
- SingleChoice
Answer : 5. "None of these "
Q:Directions: The bar diagram given below shows the productions (in the unit of thousand pieces) of three types of biscuits by a company in the five consecutive years. Study the diagram and answer the following questions.
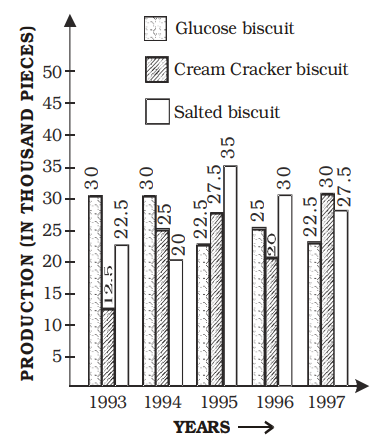
The ratio of production of glucose biscuits and total production of biscuits in that year was maximum in
888 06489af13b50f5316a45e39c2
6489af13b50f5316a45e39c2- 11994false
- 21993false
- 31996false
- 41997true
- Show AnswerHide Answer
- Workspace
- SingleChoice
Answer : 4. "1997"
Q:Directions: The table given here shows the production of five types of cars by a company in the year 1989 to 1994. Study the table and answer questions.
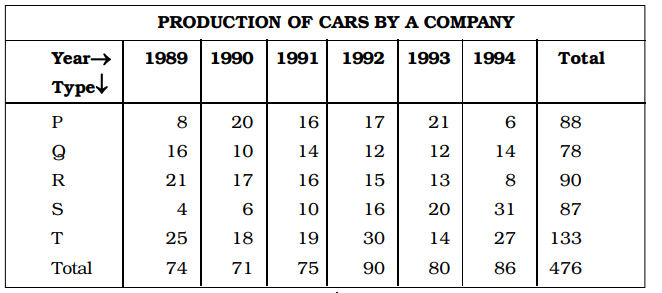
During the period 1989-94, in which type of cars was a continuous increase in production?
887 0632db292751e5310a5d0fb16
632db292751e5310a5d0fb16- 1Pfalse
- 2Qfalse
- 3Rfalse
- 4Strue
- Show AnswerHide Answer
- Workspace
- SingleChoice
Answer : 4. "S"
Q:Directions: A survery of film watching habits of people living in five cities P, Q, R, S and T is summarised below in a table. The coulmn I in the table gives percentage of film-watchers in each city who see only one film a week. The column II gives the total number of film-watchers who see two or more films per week.
Read the table and answer the following questions.
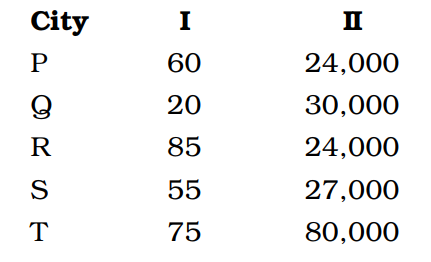
A city with the lowest number of film-watchers is :
886 0632db5b31656651c9eaaf4f1
632db5b31656651c9eaaf4f1- 1Pfalse
- 2Qtrue
- 3Rfalse
- 4Sfalse
- Show AnswerHide Answer
- Workspace
- SingleChoice
Answer : 2. "Q "
Q:Directions: The pie– chart shows the proposed outlay for different sectors during a Five–Year plan of Government of India. Total outlay is Rs. 40,000 crores. By reading the pie–chart answer the following three questions.
What is the ratio between the proposed outlay of Irrigation and Communication?
880 06489a579b50f5316a45e07b1
6489a579b50f5316a45e07b1- 19 : 8false
- 23 : 2false
- 39 : 5false
- 46 : 5true
- Show AnswerHide Answer
- Workspace
- SingleChoice