Data Interpretation Practice Question and Answer
8 Q:Direction: Study the double bar graph given below and answer the questions.
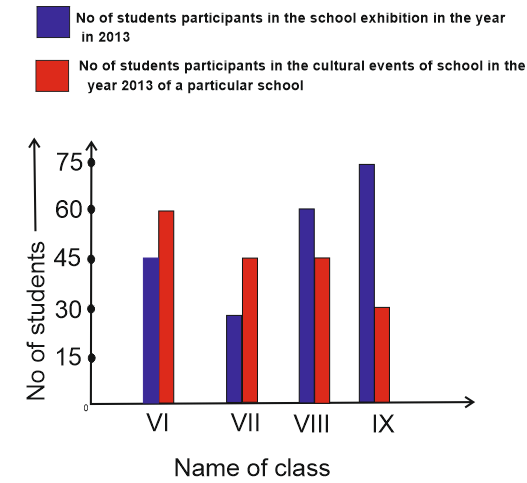
The class having maximum number of participants in exhibitions:
1901 05d932154c263b979273f36ac
5d932154c263b979273f36ac- 1Class IXtrue
- 2Class VIIIfalse
- 3Class VIIfalse
- 4Class VIfalse
- Show AnswerHide Answer
- Workspace
- SingleChoice
Answer : 1. "Class IX"
Q:Direction: Study the double bar graph given below and answer the questions.
The percentage of students of class VIII participating in cultural event out of total participants of cultural event is
4643 05d93238ac263b979273f36db
5d93238ac263b979273f36db- 130%false
- 225%true
- 335%false
- 440%false
- Show AnswerHide Answer
- Workspace
- SingleChoice
Answer : 2. "25%"
Q:Direction: Study the double bar graph given below and answer the questions.
The ratio of the participants in exhibition of class IX with the total participants of class IX is:
4047 05d9323026819c079458b8139
5d9323026819c079458b8139- 15:7true
- 25:14false
- 31:4false
- 43:5false
- Show AnswerHide Answer
- Workspace
- SingleChoice
Answer : 1. "5:7"
Q:Direction: Study the double bar graph given below and answer the questions.
The average of the number of students participating in exhibition is:
3764 05d932291bc45ad7944d99fa0
5d932291bc45ad7944d99fa0- 148.75false
- 252.5true
- 345false
- 450false
- Show AnswerHide Answer
- Workspace
- SingleChoice
Answer : 2. "52.5"
Q:Direction: Study the double bar graph given below and answer the questions.
The average of the number of students participating in cultural events is:
2970 05d9321e7c263b979273f36b1
5d9321e7c263b979273f36b1- 148.75false
- 252.5false
- 345true
- 450false
- Show AnswerHide Answer
- Workspace
- SingleChoice
Answer : 3. "45"
Q:Study the given graph carefully to answer the questions that follow:
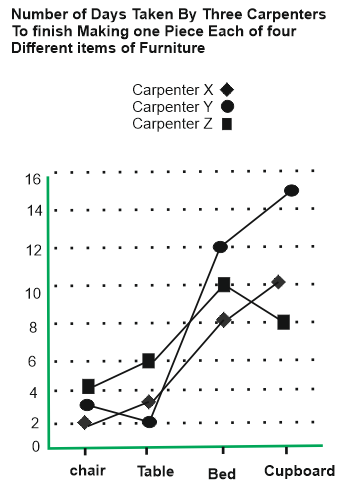
If carpenter X and carpenter Y were to make a chair together how many days would they take?
1445 05d85cf58a08f7a408051b2b8
5d85cf58a08f7a408051b2b8- 11 Daysfalse
- 24 daysfalse
- 33 daysfalse
- 42 daysfalse
- 5None of thesetrue
- Show AnswerHide Answer
- Workspace
- SingleChoice
Answer : 5. "None of these "
Q:Study the given graph carefully to answer the questions that follow:
What is the total number of days that carpenter Z will take to make one piece each of all the four items together?
1465 05d85d1eaa08f7a408051bd1f
5d85d1eaa08f7a408051bd1f- 132 daystrue
- 224 daysfalse
- 318 daysfalse
- 415 daysfalse
- 5None of thesefalse
- Show AnswerHide Answer
- Workspace
- SingleChoice
Answer : 1. "32 days"
Q:Study the given graph carefully to answer the questions that follow:
If carpenter X, Y and Z were to make a table together how many days would they take?
1739 05d85d054a08f7a408051b773
5d85d054a08f7a408051b773- 14 daysfalse
- 23 daysfalse
- 31 daystrue
- 42 daysfalse
- Show AnswerHide Answer
- Workspace
- SingleChoice