Data Interpretation Practice Question and Answer
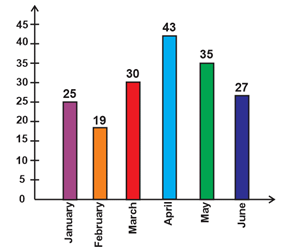
8 Q: The bar-chart is showing the number of Accidents in a city during the first six month of a year. Examine the bar chart and answer the following questions.
What is the percentage of accidents in the month of April to the total accidents in the city?

4525 05d775e76315eb75b14639a53
5d775e76315eb75b14639a53What is the percentage of accidents in the month of April to the total accidents in the city?
- 115%false
- 220%false
- 322%false
- 424%true
- Show AnswerHide Answer
- Workspace
- SingleChoice
Answer : 4. "24%"
Q: Study the following graph and answer the question that follow.

What is the approximate average number of candidates passed from all the institutes together?
3406 05d860d36a08f7a4080524b13
5d860d36a08f7a4080524b13What is the approximate average number of candidates passed from all the institutes together?
- 11460false
- 21640true
- 31350false
- 41440false
- 51530false
- Show AnswerHide Answer
- Workspace
- SingleChoice
Answer : 2. "1640"
Q: Study the following graph and answer the question that follow.
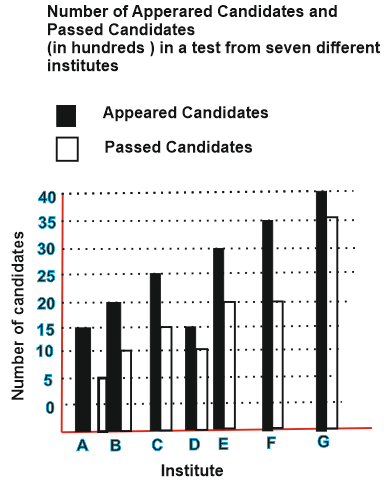 From which institute is the difference between the appeared candidates and passed candidates maximum?
1832 05d860d9bd0d7a00e4ecbb1b4
5d860d9bd0d7a00e4ecbb1b4From which institute is the difference between the appeared candidates and passed candidates maximum?- 1Bfalse
- 2Gfalse
- 3Dfalse
- 4Ftrue
- 5None of thesefalse
- Show AnswerHide Answer
- Workspace
- SingleChoice
Answer : 4. "F"
Q: Study the following graph and answer the question that follow.
 What is the respective ratio between the number of candidates who have failed from institute B and the number of candidates who have appeared from institute F?
2406 05d860deed0d7a00e4ecbb3b8
5d860deed0d7a00e4ecbb3b8What is the respective ratio between the number of candidates who have failed from institute B and the number of candidates who have appeared from institute F?- 11:7false
- 22:5false
- 32:7true
- 41:5false
- 5None of thesefalse
- Show AnswerHide Answer
- Workspace
- SingleChoice
Answer : 3. "2:7"
Q: Study the following graph and answer the question that follow.
 What is the different between the numbered of candidates appeared from institutes A, C, D and F together and candidates passed from institute-B, E and G together?
1629 05d860e49c1ed1701670c78af
5d860e49c1ed1701670c78afWhat is the different between the numbered of candidates appeared from institutes A, C, D and F together and candidates passed from institute-B, E and G together?- 13000false
- 21500false
- 32,000false
- 425000false
- 5None of thesetrue
- Show AnswerHide Answer
- Workspace
- SingleChoice
Answer : 5. "None of these"
Q: Study the following graph and answer the question that follow.
 Number of candidates passed form institutes C and E together is approximately what percentage of the total number of candidates appeared from institutes A and G together?
1765 05d860ea0a08f7a4080524e93
5d860ea0a08f7a4080524e93Number of candidates passed form institutes C and E together is approximately what percentage of the total number of candidates appeared from institutes A and G together?- 172false
- 264true
- 354false
- 477false
- 568false
- Show AnswerHide Answer
- Workspace
- SingleChoice
Answer : 2. "64"
Q: Percentage of decrease in the number of accidents from May to June is:

2099 05d77610f315eb75b14639bff
5d77610f315eb75b14639bff- 1false

- 2false

- 3false

- 4true

- Show AnswerHide Answer
- Workspace
- SingleChoice
Answer : 4. "
"
Q: By what number, is the number of accidents that occurred in April is greater than the average number of Accidents that occurred during the 6 months period?
2565 05d775ff413ddea5af63440a7
5d775ff413ddea5af63440a7- 113.17true
- 28false
- 39false
- 411false
- Show AnswerHide Answer
- Workspace
- SingleChoice