Logical Venn Diagrams Practice Question and Answer
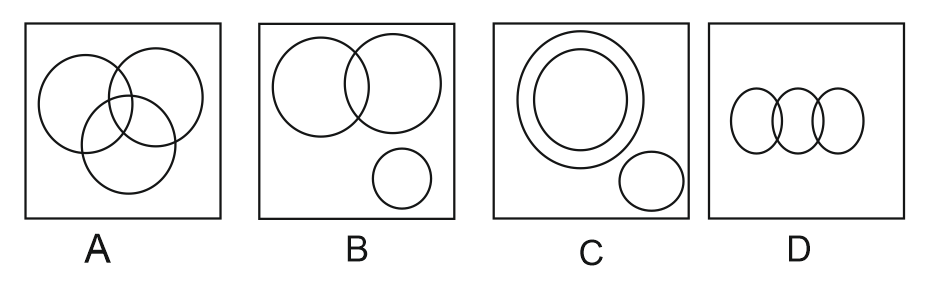
8 Q:Directions: In each of these questions, three words are related in some way. The relationship among the words in the question can best be represented by one of the five diagrams (a), (b), (c), (d) and (e) given below. Mark your answer accordingly.
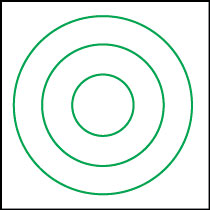
Cabinet, Home Minister, Minister
3566 05ed8b61de11a1c4b43e3c501
5ed8b61de11a1c4b43e3c501- 1false

- 2true
- 3false
- 4false
- 5false

- Show AnswerHide Answer
- Workspace
- SingleChoice
Answer : 2. "
"
Q: Identify the diagram that best represents the relationship among the given classes.
Vegetable, Park, Carrot
1958 05ed761ca22579c390050f60e
5ed761ca22579c390050f60e- 1Ctrue
- 2Afalse
- 3Bfalse
- 4Dfalse
- Show AnswerHide Answer
- Workspace
- SingleChoice
Answer : 1. "C"
Q:Direction : In a given diagram the triangle represent ‘dancer’ the circle represents ‘Footballer’. The rectangle represents Boys. And the square represents students.
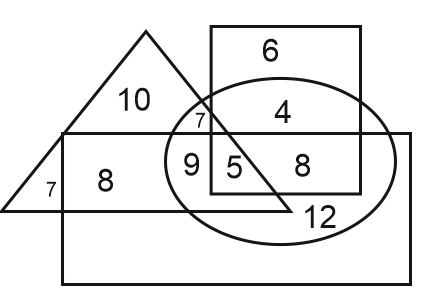
How many boys are footballer, dancer and singers?
1718 05ece0d6787aeb566495724b2
5ece0d6787aeb566495724b2- 17false
- 24false
- 35true
- 4None of thesefalse
- Show AnswerHide Answer
- Workspace
- SingleChoice
Answer : 3. "5"
Q:Direction : In a given diagram the triangle represent ‘dancer’ the circle represents ‘Footballer’. The rectangle represents Boys. And the square represents students.
How many Boys students are only footballer?
1698 05ece0cf17bb74b48ff963447
5ece0cf17bb74b48ff963447- 15false
- 28true
- 313false
- 412false
- Show AnswerHide Answer
- Workspace
- SingleChoice
Answer : 2. "8"
Q: Choose the Venn diagram that best illustrates the relationship among the following classes:
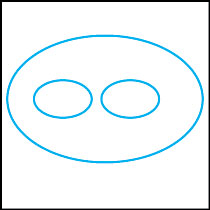
Women, Entrepreneurs, Engineers
46073 45d43c1e2f54f8b7cc9fe18af
5d43c1e2f54f8b7cc9fe18af- 1Afalse
- 2Bfalse
- 3Cfalse
- 4Dtrue
- Show AnswerHide Answer
- Workspace
- SingleChoice
Answer : 4. "D"
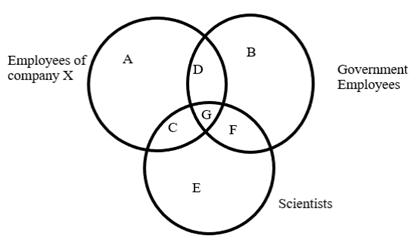
Q: Which of the following group represents all such Scientists who are Government employees as well as employed with Company X?
6809 05d4cf5a685d4e2237b5fdb36
5d4cf5a685d4e2237b5fdb36- 1Only Afalse
- 2F and Gfalse
- 3Only Gtrue
- 4Only Bfalse
- 5Not represented in the diagramfalse
- Show AnswerHide Answer
- Workspace
- SingleChoice
Answer : 3. "Only G"
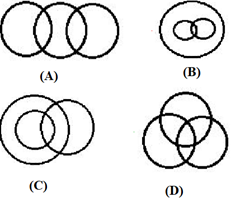
Q: Find out which of the diagrams given in the alternatives correctly represent the relation- ship stated in the question
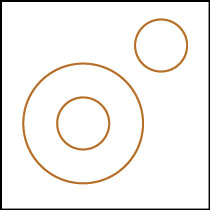
Sharks, Whales, Turtles.

4623 05d7f678ddb06d015eb34f748
5d7f678ddb06d015eb34f748Sharks, Whales, Turtles.
- 1Afalse
- 2Bfalse
- 3Cfalse
- 4Dtrue
- Show AnswerHide Answer
- Workspace
- SingleChoice
Answer : 4. "D"
Q: In the given figure, how many papers are also hard?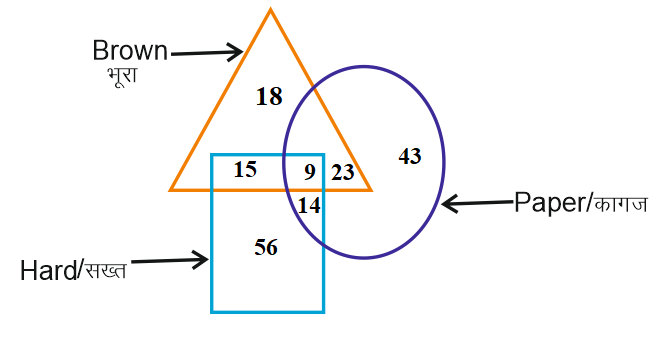
4723 05d8da64cdaae8b11b72e1c5a
5d8da64cdaae8b11b72e1c5a- 114false
- 223true
- 332false
- 434false
- Show AnswerHide Answer
- Workspace
- SingleChoice