Logical Venn Diagrams Practice Question and Answer
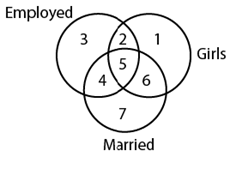
8 Q: Study the diagram below and identify the region representing girls who are employed but unmarried.
1536 160bdf16705aad558f1cd62a2
60bdf16705aad558f1cd62a2- 12true
- 24false
- 31false
- 45false
- Show AnswerHide Answer
- Workspace
- SingleChoice
Answer : 1. "2"
Q:Direction: Study the following diagram and answer question based on it-
The diagram represents the favourite ice-cream flavours of kids in a society
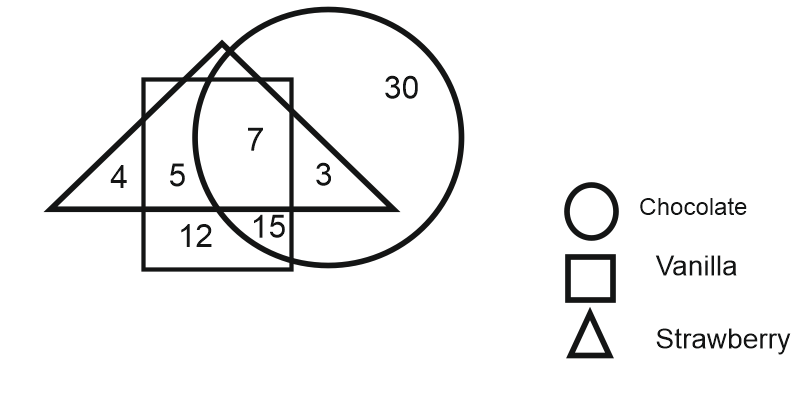
The ratio of kids who like vanilla to those who like chocolate is :
1510 05e7c40269b7cd81e41fae2d8
5e7c40269b7cd81e41fae2d8- 1$$ {12\over30 }$$false
- 2$$ {39\over45 }$$false
- 3$$ {27\over45 }$$false
- 4$$ {39\over55 }$$true
- Show AnswerHide Answer
- Workspace
- SingleChoice
Answer : 4. "$$ {39\over55 }$$"
Q:Study the following diagram and answer questions based on it.
The diagram represents the likes of kids of a class.
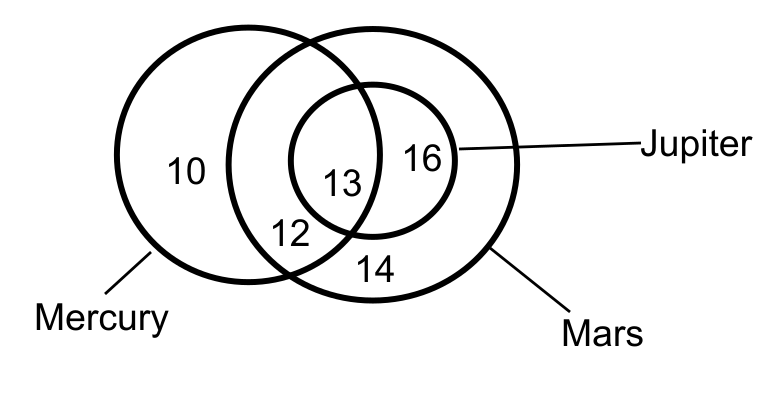
How many people who like Mars like Jupiter also?
1509 0607807acc61d5c2ec94ce801
607807acc61d5c2ec94ce801The diagram represents the likes of kids of a class.
- 145false
- 229true
- 326false
- 413false
- Show AnswerHide Answer
- Workspace
- SingleChoice
Answer : 2. "29"
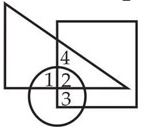
Q: DIRECTIONS: In the given diagram, circle represents wise men, square represents experienced men, triangle represents teachers. Which region represents teachers who are, wise as well as experienced?
1507 060952a080b74c22fcbaab68a
60952a080b74c22fcbaab68a- 11false
- 23false
- 34false
- 42true
- Show AnswerHide Answer
- Workspace
- SingleChoice
Answer : 4. "2"
Q:Study the following diagram and answer questions based on it.
The diagram represents the likes of kids of a class.
What is the difference between the kids who like Mercury and Jupiter?
1499 06078060f0372d8542884540e
6078060f0372d8542884540eThe diagram represents the likes of kids of a class.
- 16true
- 28false
- 310false
- 412false
- Show AnswerHide Answer
- Workspace
- SingleChoice
Answer : 1. "6"
Q: In a hall of 80 members, 45 members like Lavani, 55 members like Tamasha, 10 members like neither of the two. Then the number of members in the hall who both like is -
1441 0619b891a0e1b7c0fc6032d8b
619b891a0e1b7c0fc6032d8b- 145false
- 225false
- 320false
- 430true
- Show AnswerHide Answer
- Workspace
- SingleChoice
Answer : 4. " 30"
Q:Direction: Study the following diagram and answer question based on it-
The diagram represents the favourite ice-cream flavours of kids in a society
The ratio of kids who like both chocolate and vanilla but not strawberry?
1421 05e7c3daa959a5b337ece0788
5e7c3daa959a5b337ece0788- 15false
- 27false
- 312false
- 415true
- Show AnswerHide Answer
- Workspace
- SingleChoice
Answer : 4. "15"
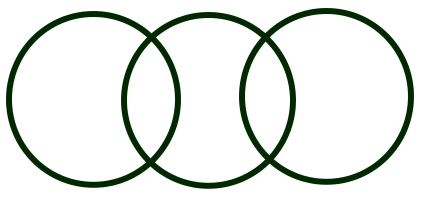
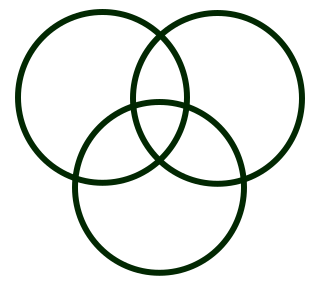
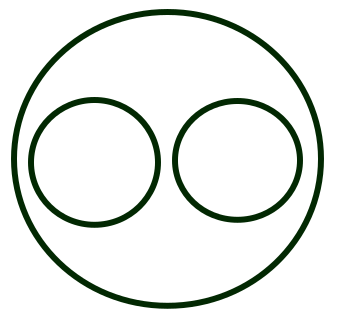
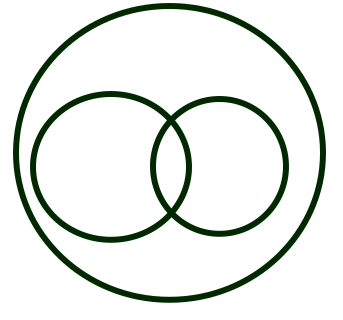
Q: Select the Venn Diagram that best represents the relationship between the following classes.
class, student, teacher
1383 05fc4b8d3a5adbb0808d24b94
5fc4b8d3a5adbb0808d24b94class, student, teacher
- 1false
- 2false
- 3true
- 4false
- Show AnswerHide Answer
- Workspace
- SingleChoice
Answer : 3. "
"