Join Examsbook
If the number of animals in zoo-B in the years 2009 is 25% more than that in the year 2007, then what is the average number of animals in zoo-B in the years 2005, 2007 and 2009?
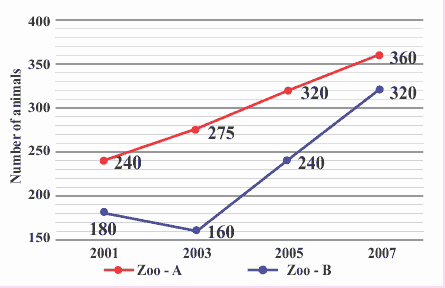
5Direction: Study the following line graph carefully and answer the questions given below.
In the below line graph, the number of animals in two zoo A and B in the years – 2001, 2003, 2005 and 2007 is given.
Q:
If the number of animals in zoo-B in the years 2009 is 25% more than that in the year 2007, then what is the average number of animals in zoo-B in the years 2005, 2007 and 2009?
- 1260false
- 2320true
- 3260false
- 4240false
- 5None of thesefalse
- Show AnswerHide Answer
- Workspace