Data Interpretation Questions Practice Question and Answer
8 Q: The following table shows the number of pens and the number of erasers of 6 different colours that were sold from a stationery store during a given week.
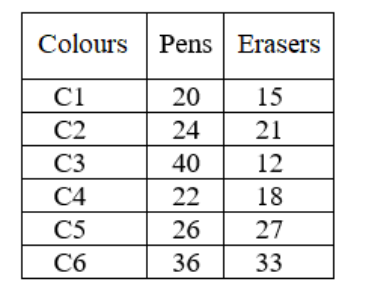
The total number of erasers having colours C3 or C4 is approximately what percentage of the average number of pens of each colour?
1781 064225b265bff3d098d0b9922
64225b265bff3d098d0b9922- 1119.16%false
- 2107.14%true
- 3115.22%false
- 4101.24%false
- Show AnswerHide Answer
- Workspace
- SingleChoice
Answer : 2. "107.14%"
Q: The following pie chart gives the measures of the central angles of the sectors that reflect the number of beds in each of 7 different hospitals with respect to the total number of beds in these 7 hospitals taken together.
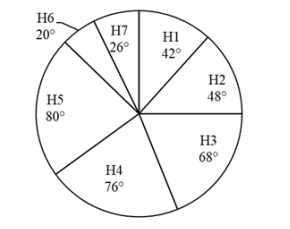
If the number of beds in H7 are 39, then what is the total number of beds in all the 7 hospitals taken together?
1469 0642251abdcb650c1456482a5
642251abdcb650c1456482a5- 1720false
- 2540true
- 3450false
- 4630false
- Show AnswerHide Answer
- Workspace
- SingleChoice
Answer : 2. "540"
Q:The following pie chart gives the central angles of the sectors representing the number of cameras sold form a shop from July to November in a certain Year.
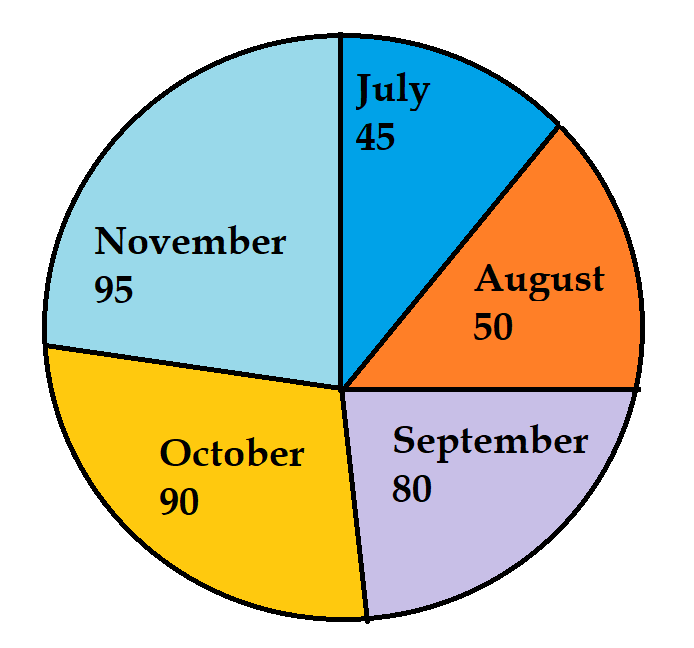
what percentage are the sales in July of the total sales from July to November
1246 06421582f32185cce3704c59f
6421582f32185cce3704c59f- 125%false
- 250%false
- 312.5%true
- 420%false
- Show AnswerHide Answer
- Workspace
- SingleChoice
Answer : 3. "12.5%"
Q:Directions: The following pie chart show proportion of population of seven villages in 2009. Stud the pie chart and answer question that follows:
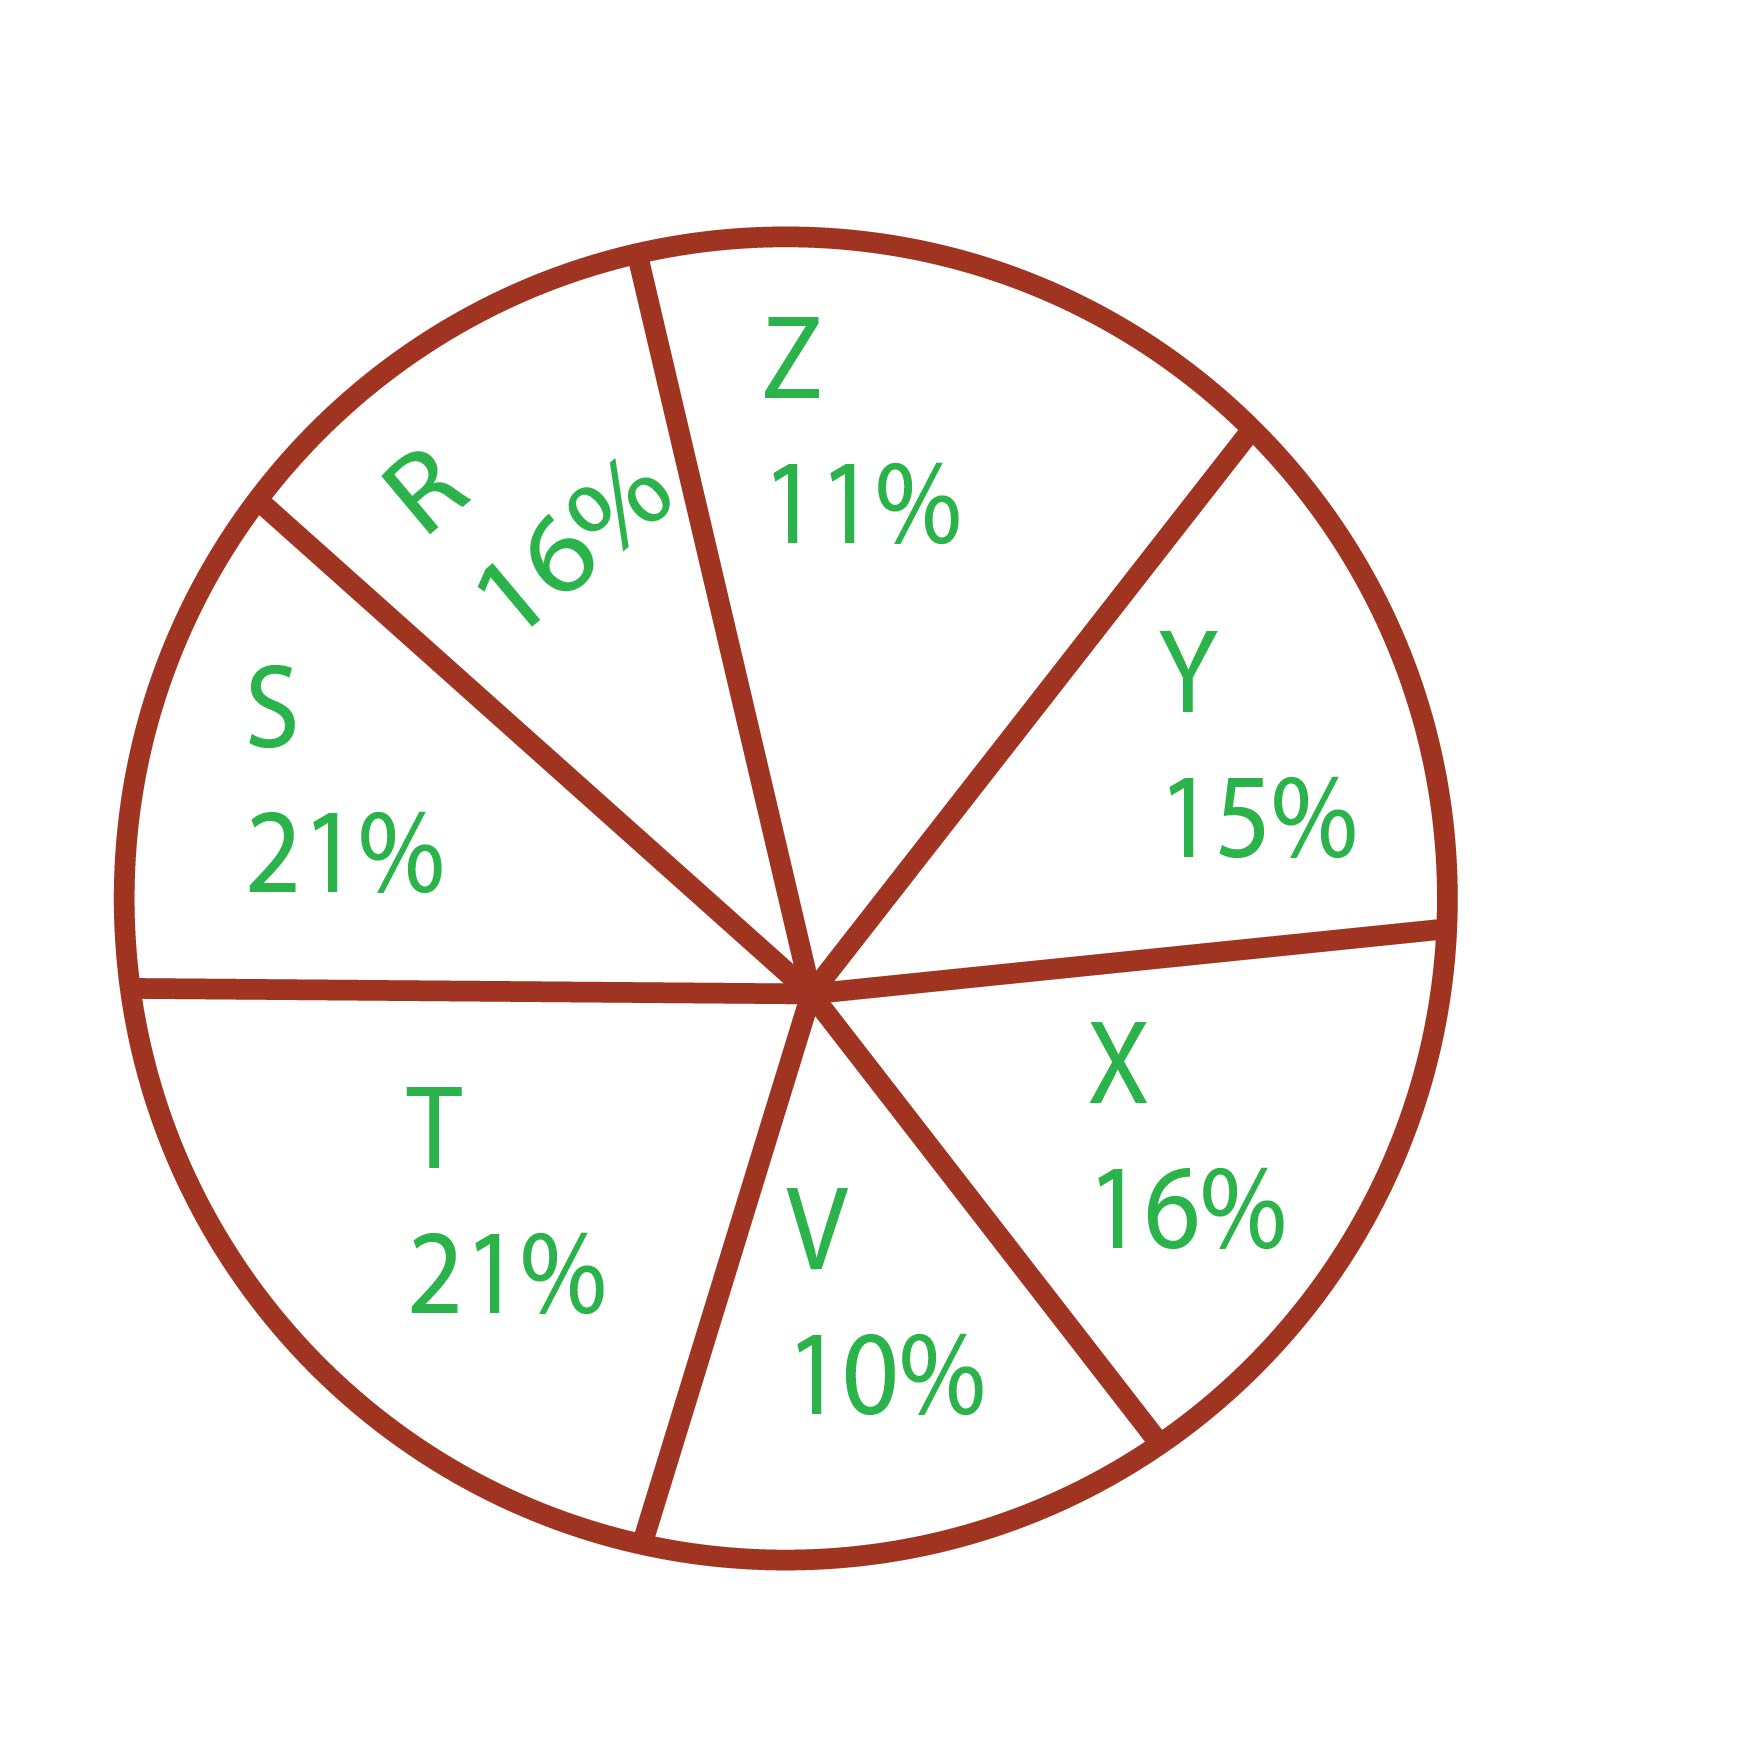
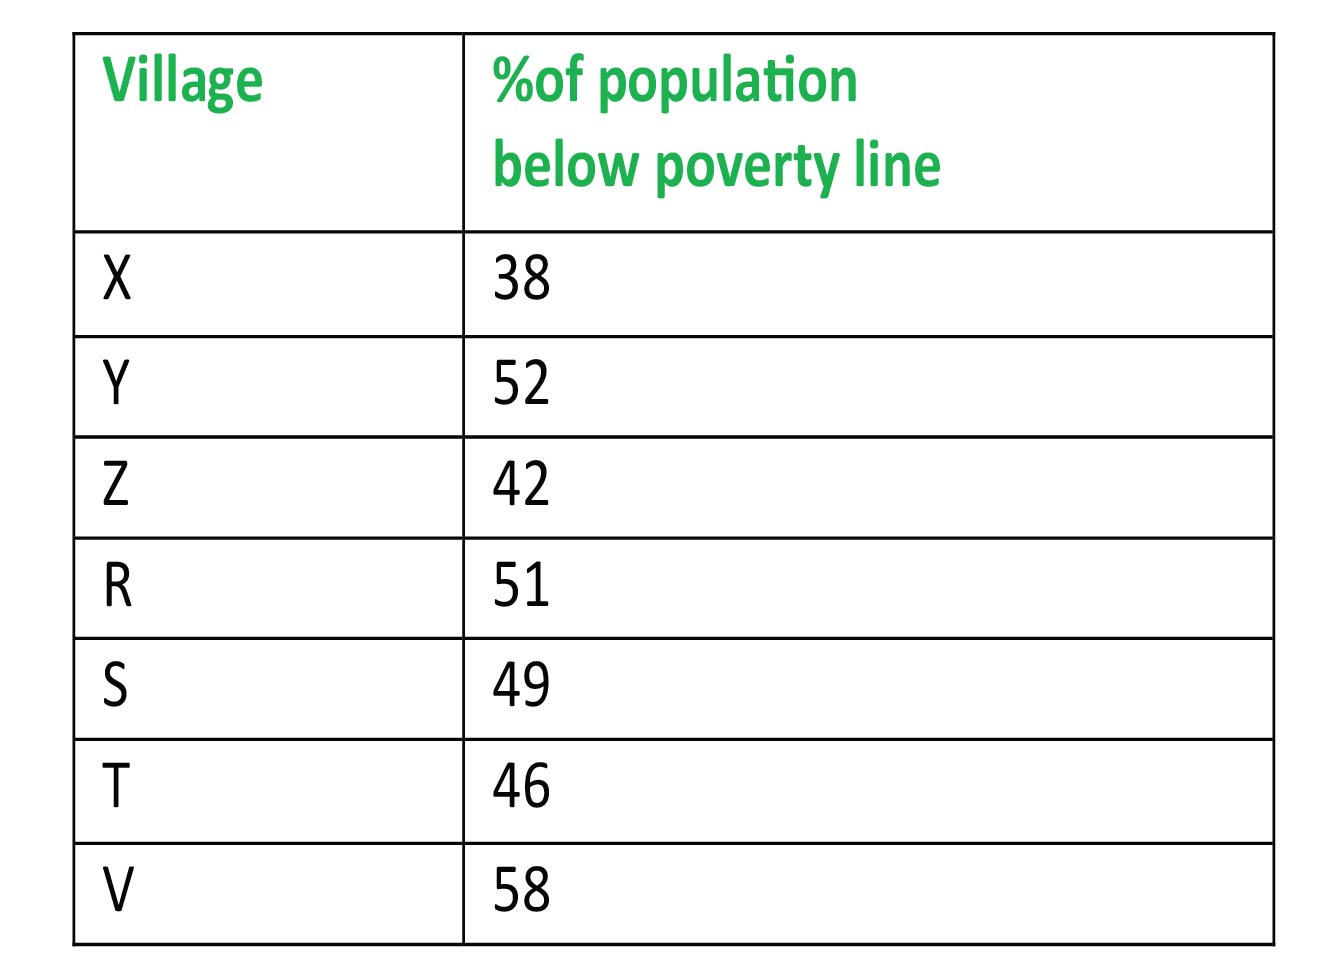
In 2010, the population of 'Y' and 'V' increases by 10% each and the percentage of population below poverty line remains unchanged for all the villages. If in 2009, the population of village Y was 30,000 then the below poverty line population of village 'V' in 2010 is-
910 0640880d7a37bb1a5e16a5bdb
640880d7a37bb1a5e16a5bdb- 111250false
- 212760true
- 313140false
- 413780false
- Show AnswerHide Answer
- Workspace
- SingleChoice
Answer : 2. "12760"
Q:Directions: The following pie chart show proportion of population of seven villages in 2009. Stud the pie chart and answer question that follows:
If the population of the village 'R' is 32000, then the below poverty line population of village Y is
942 06408805736c856ead7992198
6408805736c856ead7992198- 114100false
- 215600true
- 316500false
- 417000false
- Show AnswerHide Answer
- Workspace
- SingleChoice
Answer : 2. "15600"
Q:Directions: The following pie chart show proportion of population of seven villages in 2009. Stud the pie chart and answer question that follows:
The ratio of the below poverty line population of village 'T' to that of the below poverty line population of village 'Z' is
984 06408769836c856ead7990286
6408769836c856ead7990286- 111: 23false
- 213: 11false
- 323: 11true
- 411:13false
- Show AnswerHide Answer
- Workspace
- SingleChoice
Answer : 3. "23: 11"
Q:Directions: The following pie chart show proportion of population of seven villages in 2009. Stud the pie chart and answer question that follows:
If the below poverty line population of the village 'X' is 12160, then the population of village 'S' is
918 0640876443218fd8d147bda90
640876443218fd8d147bda90- 118500false
- 220500false
- 322000true
- 420000false
- Show AnswerHide Answer
- Workspace
- SingleChoice
Answer : 3. "22000"
Q:Direction: Study the following graph and answer the given question.
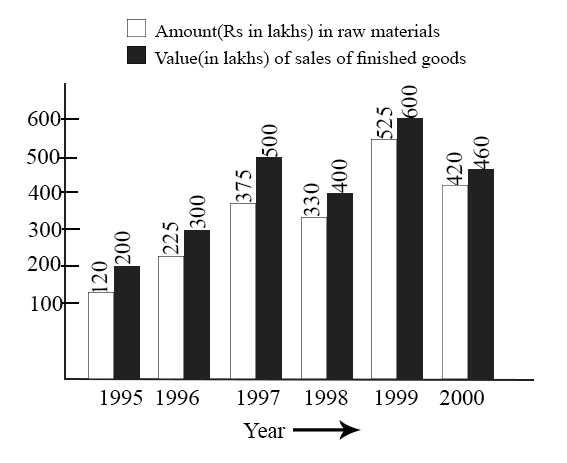
In which year, there has been a maximum percentage increase in the amount invested in raw materials as compared to the previous year?
1715 05d9dae6583cbd37fec6502ec
5d9dae6583cbd37fec6502ec- 11996true
- 21997false
- 31998false
- 41999false
- Show AnswerHide Answer
- Workspace
- SingleChoice