Data Interpretation Questions Practice Question and Answer
8 Q:The pie chart below represents the instruments played by students of a school. Read the chart and answer the following questions based on it.
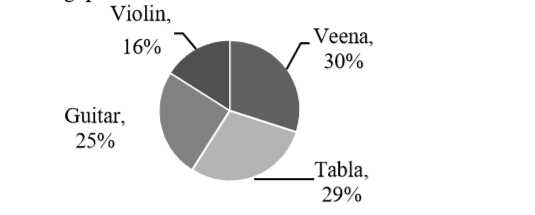
If there are 300 students in total, what is the difference between those who play Tabla and those who play Veena?
1720 05eba3072a445f56aef0ad20b
5eba3072a445f56aef0ad20b- 130false
- 290false
- 33true
- 49false
- Show AnswerHide Answer
- Workspace
- SingleChoice
Answer : 3. "3"
Q:Direction: Study the following graph and answer the given question.
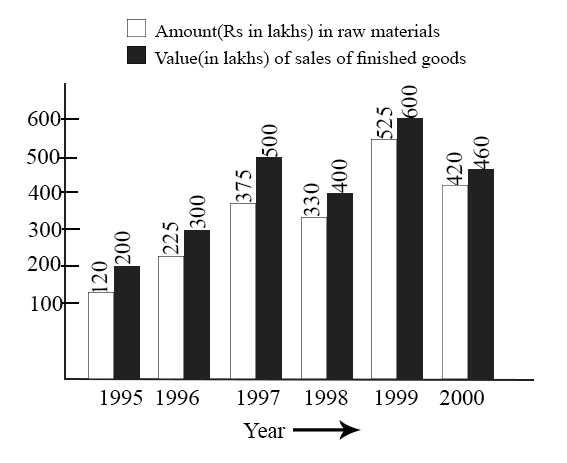
In which year, there has been a maximum percentage increase in the amount invested in raw materials as compared to the previous year?
1719 05d9dae6583cbd37fec6502ec
5d9dae6583cbd37fec6502ec- 11996true
- 21997false
- 31998false
- 41999false
- Show AnswerHide Answer
- Workspace
- SingleChoice
Answer : 1. "1996 "
Q:A bar graph showing the height of six mountain peaks. Study the bar graph and answer the following Questions.
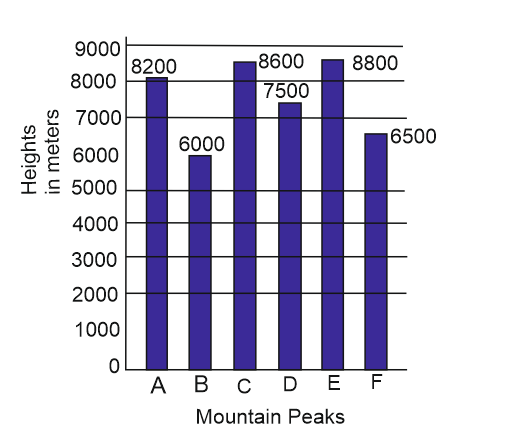
Which peak is the second highest?
1708 05f06df4d3f7f07047795f8f5
5f06df4d3f7f07047795f8f5- 1Efalse
- 2Afalse
- 3Bfalse
- 4Ctrue
- Show AnswerHide Answer
- Workspace
- SingleChoice
Answer : 4. "C"
Q:Direction: Study the following graph carefully and answer the questions that follow:
The graph given below represents the number of users of two broadband services A and B across 5 cities P, Q, R, S and T.
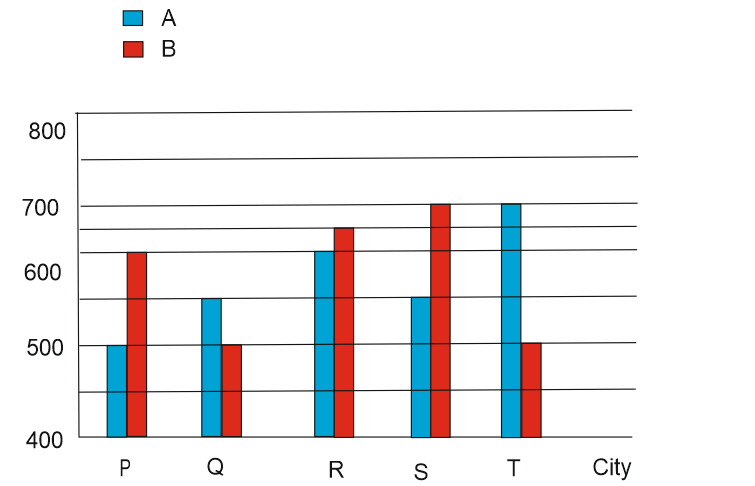
The number of users of brand A in city T is what percent of the number of users of brand B in city Q?
1695 05df0bc51e837331209ea1929
5df0bc51e837331209ea1929The graph given below represents the number of users of two broadband services A and B across 5 cities P, Q, R, S and T.
- 1150false
- 2110false
- 3140true
- 4160false
- 5120false
- Show AnswerHide Answer
- Workspace
- SingleChoice
Answer : 3. "140"
Q:The pie chart given below shows the number of shoes of 5 different brands in a multi brand store. There are total 1200 shoes.
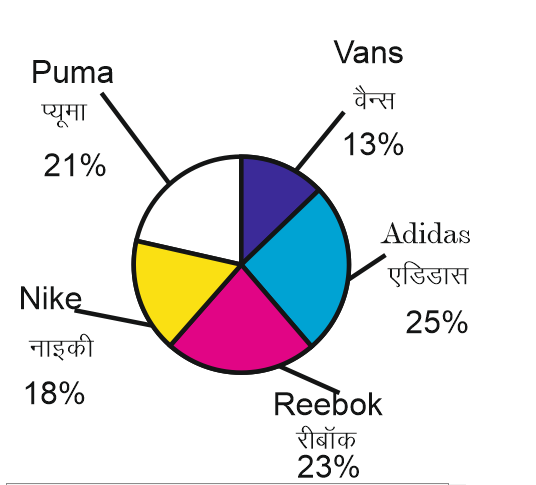
What is the difference in number of shoes of Puma and Vans?
1689 05efeb436eb90be58c5960fed
5efeb436eb90be58c5960fed- 196true
- 2156false
- 3187false
- 4112false
- Show AnswerHide Answer
- Workspace
- SingleChoice
Answer : 1. "96"
Q:Direction: Study the following information and answer the related questions. P, Q, R, S, T, A, B, C, D and E are employees of a company. A table shows the average age of any two employees of the company. The average age of A and B is 27.5.
i.e. average age of A & P is given as (A+P)/2=39.5
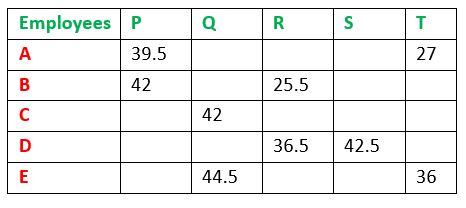
If age of P and Q is decreased by 50% and age of A and B is increased by 20%, what will be the ratio of ages of P, Q, R, S and T together to the ages of A, B, C, D and E together?
1688 06062bd1d664bf7144c915006
6062bd1d664bf7144c915006i.e. average age of A & P is given as (A+P)/2=39.5
- 1199: 133false
- 2133: 199true
- 351: 50false
- 450: 51false
- 5None of thesefalse
- Show AnswerHide Answer
- Workspace
- SingleChoice
Answer : 2. "133: 199"
Q:The following Charts shows the amount of grain exported (in million kg ) by a country during 2013–18.

In which year did jute exports become the highest?
1685 05f645298becdf06fd26560ad
5f645298becdf06fd26560ad- 12014false
- 22016false
- 32018true
- 42017false
- Show AnswerHide Answer
- Workspace
- SingleChoice
Answer : 3. "2018"
Q:Directions-Study the following diagram and answer the four questions.
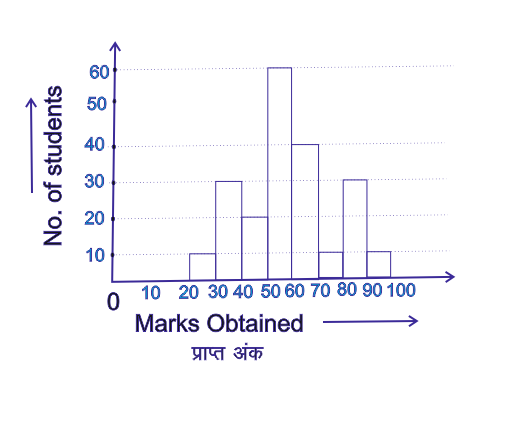
The no. of students securing marks in the range 90-100
1682 05daea617622dcb0d26318c07
5daea617622dcb0d26318c07- 110true
- 220false
- 330false
- 440false
- Show AnswerHide Answer
- Workspace
- SingleChoice