Data Interpretation Practice Question and Answer
8 Q: The following pie-chart shows the study-time of different subject of a student in a day. Study the pie chart and answer the following questions.If then student studies chemistry for 3 hours, then he/she studies geography for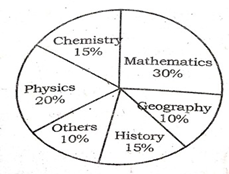
2157 05d1efcb6c068c021a4048f2f
5d1efcb6c068c021a4048f2f- 11 hourfalse
- 22 hourtrue
- 31 hour 30 minutesfalse
- 42 hour 30minutesfalse
- Show AnswerHide Answer
- Workspace
- SingleChoice
Answer : 2. "2 hour"
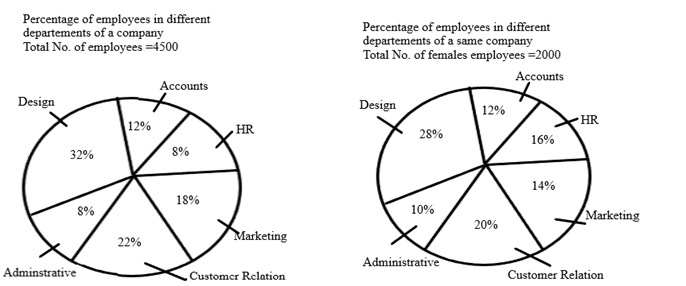
Q: The number of females in the Marketing department are approximately what percent of the total employees in marketing and customer Relation department together?
6103 05d4aba5e11160f20523749fa
5d4aba5e11160f20523749fa- 126false
- 236false
- 36false
- 446false
- 516true
- Show AnswerHide Answer
- Workspace
- SingleChoice
Answer : 5. "16"
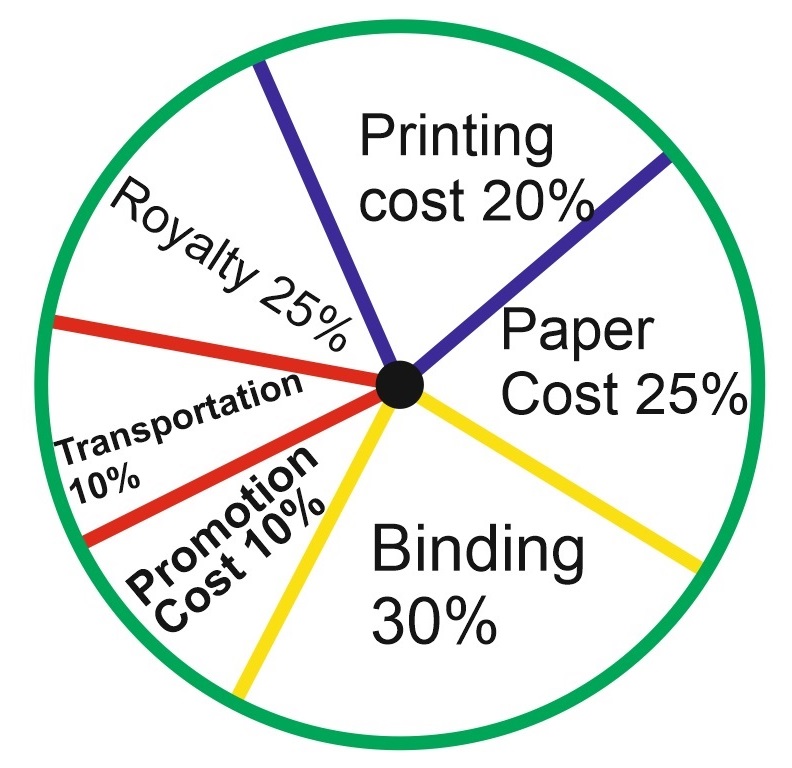
Q: If for a certain quantity of books, the publisher has to pay Rs. 30,600 as printing cost, then what will be the amount of royalty to be paid for these books?
2104 05d70b6cad8eebc768d112b28
5d70b6cad8eebc768d112b28
- 1Rs. 19,450false
- 2Rs. 21,200false
- 3Rs. 22,950true
- 4Rs. 26,150false
- Show AnswerHide Answer
- Workspace
- SingleChoice
Answer : 3. "Rs. 22,950"
Explanation :
Let the amount of Royalty to be paid for these books be Rs. p.
Then, 20 : 15 = 30600 : r ⇒ r = Rs. ![]() = Rs. 22950.
= Rs. 22950.
Q:Study the given graph carefully to answer the questions that follow:
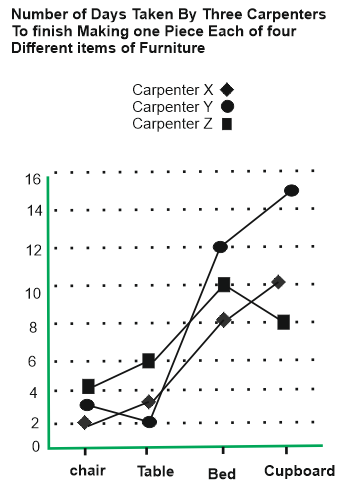
If carpenter X and carpenter Y were to make a chair together how many days would they take?
1445 05d85cf58a08f7a408051b2b8
5d85cf58a08f7a408051b2b8- 11 Daysfalse
- 24 daysfalse
- 33 daysfalse
- 42 daysfalse
- 5None of thesetrue
- Show AnswerHide Answer
- Workspace
- SingleChoice
Answer : 5. "None of these "
Q:Directions-Study the following diagram and answer the four questions.
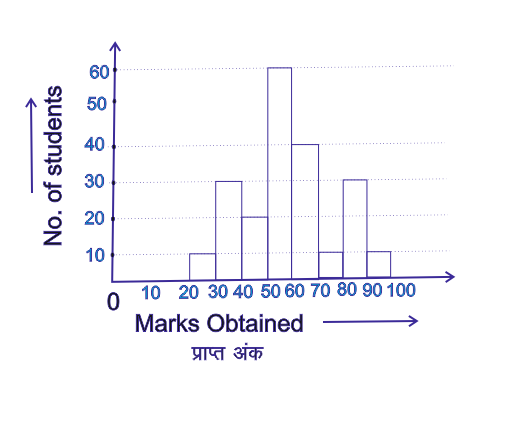
The percentage of students securing marks less than 50 is
1901 05daea745622dcb0d26318ea7
5daea745622dcb0d26318ea7- 1$$ 28{4\over 7}%$$true
- 2$$ 25{5\over 7}%$$%false
- 3$$ 23{13\over 21}%$$%false
- 4$$ 47{13\over 21}%$$%false
- Show AnswerHide Answer
- Workspace
- SingleChoice
Answer : 1. "$$ 28{4\over 7}%$$"
Q:Study the following graph to answer these questions :
Percent profit earned by two companies A & B over the years.
Profit = Income – Expenditure
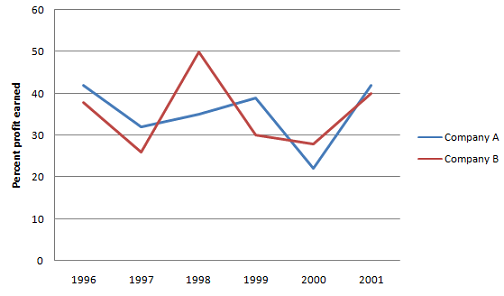
If the expenditure of Company A in 1997 was Rs.70 lakhs and income of Company A in 1997 was equal to its expenditure in 1998, what was the total income (in Rs. lakh) of the Company A in 1997 & 1998 together?
2815 05e79ab3f8560ba13b0276082
5e79ab3f8560ba13b0276082Percent profit earned by two companies A & B over the years.
Profit = Income – Expenditure
- 1175false
- 2131.25false
- 3218.75true
- 4Cannot be determinedfalse
- 5None of thesefalse
- Show AnswerHide Answer
- Workspace
- SingleChoice
Answer : 3. "218.75"
Q:Study the given graph and answer the question that follows.
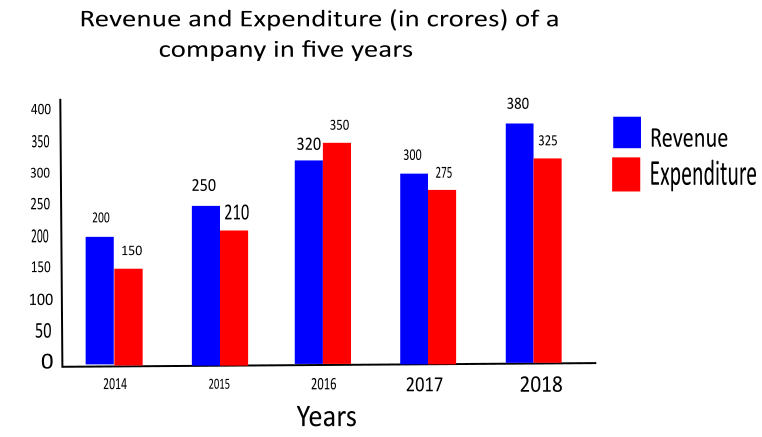
What is the ratio of the total expenditure in 2015 and 2016 to the total revenue of the company in 2016 and 2018?
1768 05fbf78fa4f2f6c622be787d2
5fbf78fa4f2f6c622be787d2- 16 : 7false
- 219: 20false
- 34 : 5true
- 411 : 20false
- Show AnswerHide Answer
- Workspace
- SingleChoice
Answer : 3. "4 : 5"
Q:Direction: The line chart given below shows number of labourers (men and women) working in six different years. Study the data carefully and answer the following questions.
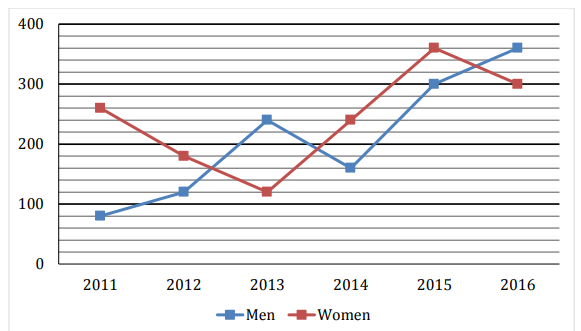
The average number of Women working in 2014, 2015 and 2016 together is how much more/less than average number of Men working in 2011, 2014 and 2016 together?
750 064d4b2f2a798377447221ad1
64d4b2f2a798377447221ad1- 1100true
- 280false
- 390false
- 470false
- 5None of the given optionsfalse
- Show AnswerHide Answer
- Workspace
- SingleChoice